Swing Trade Buy Level On $CVXChevron Corporation (NYSE:CVX) continues to trade at multi-month lows and the downside still has a little more to go. Investors should expect continued weakness on mega energy company Chevron Corp until it hits $103.75. At that point, Chevron becomes a buy for a swing trade. The upside will come quickly, probably through more middle east tension on oil. Smart investors will wait patiently to buy Chevron Corp at $103.75, then sell when it bounces to $107.50.
CVX trade ideas

Feeding The Chevron BearsOn April 7, 2017, the Chevron Corporation ( CVX ) crossed below its 150 day moving average (MA). Historically this has occurred 253 times and the stock does not always drop. The stock has a median loss of 3.162% and a maximum loss of 55.271% over the next 15 trading days.
When we take a look at other technical indicators, the relative strength index (RSI) is at 48.9096. RSI tends to determine overbought and oversold levels as well as likelihood of price swings. I personally use anything above 75 as overbought and anything under 25 as oversold. The current reading declares the stock is relatively neutral, with no clear volatile price swing on the horizon.
The true strength index (TSI) is currently -16.6606. The TSI determines overbought/oversold levels and/or current trend. I solely use this as an indicator of trend as overbought and oversold levels vary. The TSI is double smoothed in its calculation and is a great indicator of upward and downward movement. The current readin declares the stock is down, and has remained around its current reading for a few weeks. This indicator should have moved up or down by now which adds to the uncertain future and leaves a drop in the stock price well within play.
The positive vortex indicator (VI) is at 1.0845. When the positive level is higher than 1 and higher than the negative indicator, the overall price action is moving upward. When the negative level is higher than 1 and higher than the positive indicator, the overall price action is moving downward. The current reading declares the stock is moving up.
The stochastic oscillator K value is 71.4480 and D value is 69.7333. This is a cyclical oscillator that is highly accurate and can be used to identify overbought/oversold levels as well as pending reversals. I personally use anything above 80 as overbought and below 20 as oversold. When the K value is higher than the D value, the stock is trending up. When the D value is higher that the K value the stock is trending down. The current reading declares the stock has been moving up, but the divergence between the two has recently narrowed and a downturn is likely to quickly occur.
Considering the moving average crossover, RSI, TSI, VI and stochastic levels, the overall direction appears to be heading down. Based on historical movement compared to current levels and the current position, the stock could lose another 2.28% over the next 15 trading days. On the day previous to this negative cross below the MA, the stock crossed above. The last 11 times in the past decade, the stock crossed and closed below the MA one day after it closed above the MA, the stock dropped a minimum of 1.728%.

Chevron is not in the clear yetOn March 27, 2017 Chevron (CVX) crossed below the 200 day moving average (MA). Historically this has occurred 228 times. When this happens, the stock does not always continue to drop. It has a median drop of 3.615% and maximum drop of 54.094% over the next 15 trading days.
When we take a look at other technical indicators, the relative strength index (RSI) is at 33.8291. RSI tends to determine overbought and oversold levels. I personally use anything above 75 as overbought and anything under 25 as oversold. The current reading declares the stock is trending downward.
The true strength index (TSI) is currently -17.8724. The TSI determines overbought/oversold levels and/or current trend. I solely use this as an indicator of trend as overbought and oversold levels vary. The TSI is double smoothed in its calculation and is a great indicator of upward and downward movement. The current reading declares the stock is trending downward.
The negative vortex indicator (VI) is currently 1.2387. The VI determines current trend and direction. When the positive level is higher than 1 and higher than the negative indicator, the overall price action is moving upward. When the negative level is higher than 1 and higher than the positive indicator, the overall price action is moving downward. The current reading declares the stock is trending downward but it could rebound soon.
Considering the moving average crossover, RSI, TSI, and VI levels, the overall near-term stock direction appears to be trending downward. Based on historical movement compared to current levels and current overall downtrend channel, the stock could gain at least another 2% over the next three weeks.


BreakOut ahead?Above the Top at 118.9 i exspect the next bo-move. This upwave could reach upt to 123$
Trading below 116,6/115 could initiate a consolidating downwave with the TPs: 111,6/109,3/107
Best Regards
Mary

CVXCVX has been a leader in the energy sector. With the recent sell off the energy names, it would interesting to look at CVX. Lets see how it acts in this area. XLE already broke the 200 day. Looking for a potential short in the retest areas overhead.


CVXPrice close to the trend line, but still sliding down. Break of the falling line would be good opportunity to buy. First target 119.00

CVX - Swing Trade LongCVX has moved up nicely and is among the stronger stocks in the XLE sector. Prices topped out in the $119 level and retraced with weak bear candles.
I'm looking for a move down to the $110/$109.5 level, which corresponds to a 50% Fib retracement.
Play to potential price target @ 122.50. First profit target @ $119 (Previous High).
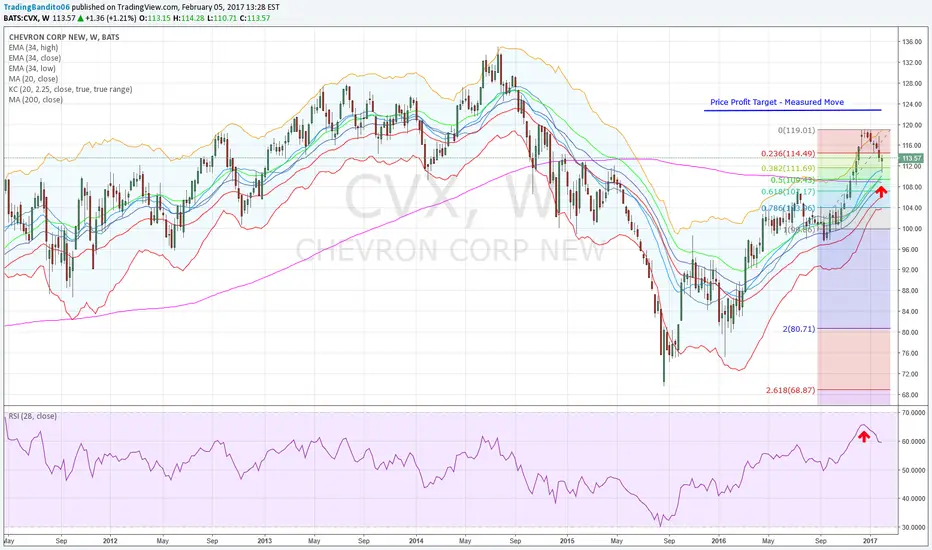
CVX Swing Trade LongCVX has been in a nice uptrend and is among the stronger stocks from the XLE sector. Prices reached $119 and have retreated in an orderly manner. The price target for a measured move is at the 122-123 level, so I would suspect another leg up to complete the move.
I am looking for prices to retrace to the $110 level and will buy Calls. Price target is the previous high of $119 and the MM target of $122.
Good Hunting!

Bearish Head&Shoulders FormedCVX is one of the most bullish stocks I have seen so shorting this will be tough but a head and shoulders has formed and support has been broken by a bearish candle with good volume. I think the stock will retest the neck line for an entry and then trade down to the 200-simple.
Here is the setup
Trigger: 99.36
Stop:101.01
Target 1:96.07
Target 2: 92.93
***Thoughts***My thoughts on CVX is that when gas was trading around this same price last year the stock was trading around 85-90/per share. It has had a bullish run up for the summer which was predicted in an early post you can link to below but I think the stock price comes down with the less travel demand. CVX is also keeps financing the dividend with debt which I believe is a bad idea. If oil doesn't move up, CVX will have to lower the dividend. If this happens I believe we see 2015 Lows. I will be a buyer


2 Trend are with youBoth the big one and the small one are running in the same direction.
I Think we will see prices above 120$

CVX @ daily @ closed higher last 3 trading days every dayThis is only a trading capability - no recommendation !!!
Buying/Selling or even only watching is always your own responsibility ...
.zip (with PDF`s) @ my Google Drive
Closings Bullish (Dow Jones Index incl. all shares)
drive.google.com
Best regards :)
Aaron


CVX @ 1h @ will the 116 & upside trend (since end of oct) hold ?Take care
& analyzed it again
- it`s always your decision ...
(for a bigger picture zoom the chart)
Best regards
Aaron

SELL SET UPWe have a nice bat pattern in development on weeekly time frame.
it would be a good idea to sell when price reached d point.

CVX @ 15 min @ GAP (116 & 118) should be a recreational poolCVY got an challenging 15min chart - no question !!! But also tradeable ...
The trend channel starts more or less around 114 & 116 this week & ends around 115 & 117 more or less. But much more important is the GAP (after OPEC news while weekstart - even last monday) even between 116 & 118. `cause you can see, while last trading day (on friday) traders traded CVX in something like a breakout-formation (two times higher highs & higher lows) - but under weekly high from monday. And from thuis point of view, i am wouldn`t wondering if CVX the GAP develop to something like a recreational pool next week (between 116 & 118) ...
Take care
& analyzed it again
- it`s always your decission ...
(for a bigger picture zoom the chart)
This is only a analysis (for swing traders) - no recommendation !!!
Buying/Selling or even only watching is always your own responsibility ...
With swing trading i mean (in this context) until end of this trading week :)
Best regards
Aaron
