E*TRADE 6-Month Performance - While the YTD performance looks pretty flat, the last year has really shown a different story for E*TRADE.
It seems apparent the TD <> Schwab proposed merger leaves some questions as to E*TRADE's future... however, as one of the largest volume players... it could be a great deal for someone with a strategic direction or alternative business line.
ENI trade ideas

ENI - Long term - Early entry on possible 40-50% gainENI has been retracing for a long time now.
Stock might be very close to a turning point to the upside.
Long term gain might be around 40-50%.

OIl and ENI: Spread OpportunityGood opportunity on the Italian Market to be exploited with a spread trade.
Usually ENI and Oil have a positive correlation. In that case we could open a position on ENI and hedge it with another position on Oil trading on the temporary spread between the two securities.
My position here is to sell ENI and buy Oil waiting for the spread to reach again the base line of the Bollinger Bands (orange crosses).
Investing Fellow
Disclosure: My ideas contain statements and projections based on assumptions on capital markets, and therefore inherently subject to numerous risks and uncertainties.
Before buying or selling any stock you should do your own research and reach your own conclusion or consult a financial advisor. Investing includes risks, including loss of principal.
I am not a financial advisor.


predictable at least until nowthis was very predictable in the past , the channel it was inside has been broken on last days so I'm short here


ENI_Intraday scenarios_17-07Entry triggers for today's session 17-07:
Below 15.97 - Bearish scenario
Aboce 16.10 - Bullish scenario


ENI IS A BUY! 1st TARGET AT 17 EuroHello Guys,
Let's buy Eni - 1st target at 17 Euro
A long white candle is closing above the upper Bollinger Band- MACD and RSI both indicating strenghtness
See you soon,
Simone

LONG ENI AT 14,86, trendline has been broken. Strong bullishI am long ENI from 14,86, currently up +6,19%.
Holding the ground, long term.

ENI TRADE UPDATE: Keep calm and keep buying, eyeing 20 euro.Everything is going accoriding to plan on the ENI trade.
Waiting for 20 euro target :-)


Bullish Oil Futures = Energy Companies #10 (E)Deep pullback but is more safe buy now because the bad has happened
In Feb 5, 2018 Dow drops 1,175 points the biggest point drop In history and historically after big falls like the Black Monday October 19, 1987
Remember that after the shock, strong hands buy stocks.
About the resistance line:
Resistance Line is an (Area, Zone, Sector)
Between 31.90 to 34.70 or something not exact.
In this chart in particular, is because is a foreign company, but the stock have enough liquidity, exactly the Avg-Volume is 212,531
Other aspect with the resistance line in this chart is because this is a foreign company and there tend to be constant intraday gaps during a week,
But at the end this stock is liquid
Again I repeat the Avg-Volume is 212,531

Possible bullish scenario on ENI.ENI is a interesting stock, on the long run it could provide massive profit. (if everything goes fine)


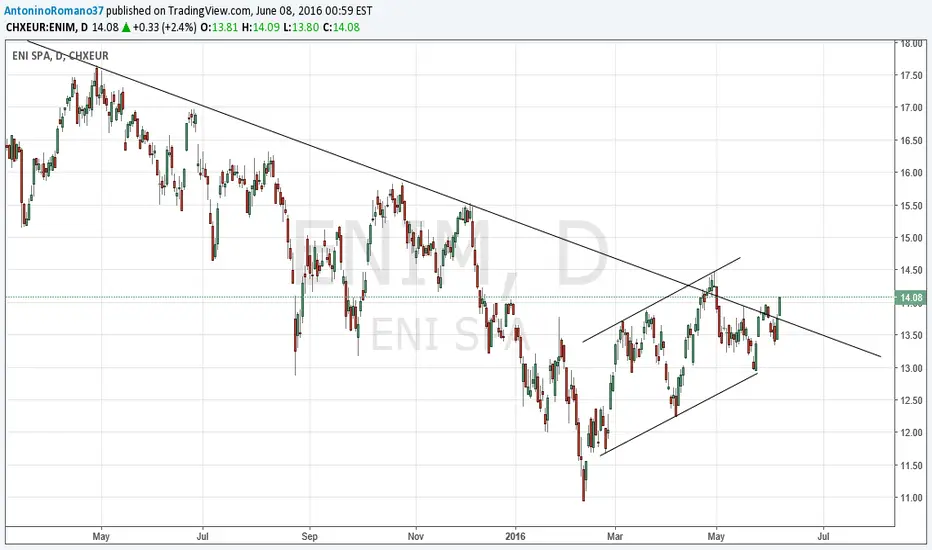
ENIM - ENI SPA GOING FOR MORE DOWNSIDE?ENI seems in a downtrend continuation into a descending channel. I'm expecting one more test on lower channel before a possible breakout to the upside. Now the price is breaking the rising correction with a bearish divergence.

ENIENI is breaking out of a triangle. The 50 day moving average is about to cross in a bullish manner the 200 day moving average.