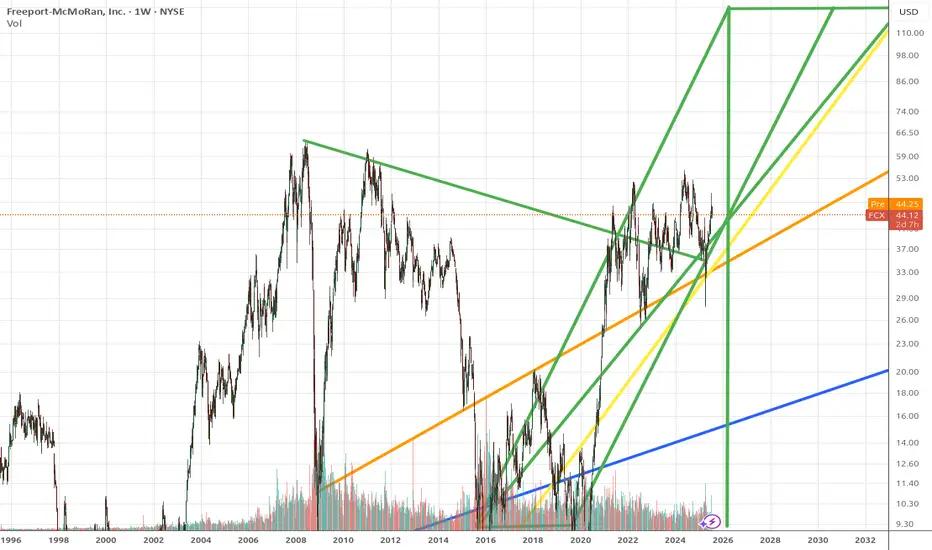
New normal for FCXWhen gold and silver are high and copper is in high demand as well as other metal, FCX goes balistic
FCX trade ideas
FCX)| Long | Metal Demand Surge | (June 16, 2025)Freeport‑McMoRan (FCX) | Long | Inverse Head & Shoulders + Metal Demand Surge | (June 16, 2025)
1️⃣ Short Insight Summary:
FCX appears to be forming an inverse Head & Shoulders pattern, signaling a potential bullish reversal. Strong fundamentals and rising metal demand align with this technical setup.
2️⃣ Trade Parameters:
• Bias: Long
• Entry: $34 (targeting neckline retest)
• Stop Loss: $30 (below pattern’s right shoulder support)
• Take Profit 1 (TP1): $38–$42 (entry-level resistance)
• Take Profit 2 (TP2): $46–$48 (next resistance band)
• Final Target: $50 (room to let remainder run beyond pattern breakout)
3️⃣ Key Notes:
✅ Company posted ~$0.42 EPS last quarter, with ~$25 B in revenue and ~$2 B net income.
✅ Forward estimates suggest EPS growth through 2027—historically accurate with recent beats.
✅ Beta ~1.075, slightly above market, indicating modest volatility.
✅ FCX is a global player—leading copper, gold, and moly producer across North America, South America, Africa.
✅ Technical structure, supported by trajectory in metal demand, strengthens bullish case.
4️⃣ Optional Follow‑up Note:
Will monitor for confirmation of neckline breakout. If price closes above $38 with volume, consider shifting stop to breakeven and scaling into the position.
Please LIKE 👍, FOLLOW ✅, SHARE 🙌 and COMMENT ✍ if you enjoy this idea! Also share your ideas and charts in the comments section below! This is best way to keep it relevant, support us, keep the content here free and allow the idea to reach as many people as possible.

FCX BullishPossible range POC reclaim here
Might be able to get a better price closer to POC for nicer risk/reward next week
SL 33.74
TP1 46-47
TP2 50-51
TP3 61.50
Looking for an Entry Copper is about to shoot up. Not sure if this will fall to $12 but I’m holding out until it does to take a long position.

FCX - We had a great month, can we continue with the uptrend?FCX
Looking for a potential buy!
🔍 Technical Context:
FCX had a tremendous up-beat with 24% increase in the stock just in march!
MACD Bullish Crossover: A clear bullish cross on the MACD confirmed upward momentum.
RSI Strength: The RSI remains in bullish territory, signaling further upside potential.
Favorable Risk-Reward Setup: The stock maintains support above breakout levels, offering an attractive trade opportunity.
📰 Fundamentals
Analyst Upgrades: J.P. Morgan and Scotiabank both issued upgrades and increased their price targets, reflecting confidence in FCX’s future performance.
Tariff Advantage: Potential U.S. tariffs on imported copper could benefit domestic producers like Freeport-McMoRan, increasing their advantage.
Strategic Policy Support: FCX is advocating for copper to be classified as a critical mineral, which could unlock tax credits and boost annual profits by up to $500 million.
📌 Trade Plan
📈 Entry: 41.90
✅ Target: 58.30
❌ SL: 23.90
💡 Looking for a potential 35% increase!

Freeport McMoran - Run with copper...1. Trend Analysis
Overall Trend: The stock has been in a downtrend since mid-2023 but is showing signs of a potential reversal.
Recent Price Action: The stock recently bounced from a support level around $35.59 - $37.43, indicating a possible trend reversal.
Moving Averages: The stock is trading near short-term moving averages, suggesting a consolidation phase. It needs to break above the key resistance levels (around $39.17 - $41.63) to confirm an uptrend.
2. Key Support & Resistance Levels
Support: $35.59 (recent low) and $37.43
Resistance: $38.09, $39.17, and $41.63
3. Indicator Analysis
MACD (Moving Average Convergence Divergence): The MACD is showing a bullish crossover, indicating potential upward momentum.
RSI (Relative Strength Index): RSI is near 52.13, suggesting the stock is approaching a neutral-to-bullish zone but is not yet overbought.
Volume: A significant increase in volume indicates strong buying interest, which supports the bullish case.
4. Divergence Signals
Bullish Divergence: The price made a lower low, while RSI and MACD made higher lows, indicating potential upward momentum.
5. Trade Setup
Long Entry: Above $38.09, with confirmation above $39.17.
Stop-Loss: Below $37.43 (as marked on the chart).
Take-Profit Targets:
First target: $40.79
Second target: $41.63
Further target: $44.30
Conclusion
Bullish Reversal Possible: The stock is showing a potential trend reversal with bullish divergence and increasing volume.
Breakout Confirmation Needed: A close above $39.17 would strengthen the bullish case.
Risk Management: A stop-loss below $37.43 is recommended in case the price fails to hold support.

Opening (IRA): FCX July 18th 25/March 21st 39 Long Call Diagonal... for an 11.02 debit.
Comments: Taking a directional shot post-earnings on weakness, buying the back month 90 delta call and selling the front month 30 delta that pays for all of the extrinsic in the long, resulting in a break even that is slightly below where the underlying is currently trading.
Metrics:
Buying Power Effect: 11.02
Break Even: 36.02/share
Max Profit: 2.98
ROC at Max: 27.04%
With these, I generally look to take profit at 110% of what I put them on for and/or look to roll out the short call to reduce my cost basis/downside break even should that not be hit.

FCX Freeport-McMoRan Options Ahead of EarningsAnalyzing the options chain and the chart patterns of FCX Freeport-McMoRan prior to the earnings report this week,
I would consider purchasing the 40usd strike price Calls with
an expiration date of 2025-2-21,
for a premium of approximately $1.94.
If these options prove to be profitable prior to the earnings release, I would sell at least half of them.

13x range bound & IH&S brk out Bullish Gold play 13 x from here on multi year chart
Gold in triangle breakout
CRB in triangle breakout (Commodities Index)
nice wind up RHS shoulder is triangle wedge pattern with retest
double bottom in the head part of the pattern too

$FCX - Looks goodNYSE:FCX Here is a better chart. It is trading inside a descending broadening wedge. If it plays out we are look at $44 area.
As always, I share my opinions and trades. I'm not suggesting that anyone follow my trades. You do you.

Can We Get +EV from EV? With stocks like FCX, sometimes the answer isn’t just about gold—it’s about finding the copper that holds everything together.
While everyone scrambles for the gold nuggets in the mainstream Electric Vehicle (EV) market, you might be missing opportunities further upstream in the feeder streams. These are the overlooked areas that quietly power the whole operation. As I work on my 2025 guide to researching and finding hidden gems in this very market, I stumbled upon a curious situation that’s sometimes overlooked when researching a stock: a well-timed opportunity to combine deeper research with the possibility of an early position.
What is that opportunity, you ask? Well, it’s all about timing and understanding the mechanics of dividends, coupled with an upcoming earnings catalyst.
The Hidden Value in Copper
Let’s face it—copper wire isn’t exactly the sexiest investment out there. But sometimes, the dressed-down stock has a greater long-term value precisely because it spans multiple industries. Copper isn’t just critical for EV motors and renewable energy—it’s a foundation material for infrastructure, electronics, and more.
Enter Freeport-McMoRan Inc. (FCX). This copper powerhouse caught my attention for two key reasons:
1. A dividend payout date approaching on Jan 15, offering a 1.6% yield.
2. An earnings report set for Jan 23, creating the potential for amplified movement shortly after the dividend window.
Now, before you jump in, remember: this isn’t about chasing dividends or speculative hype. Instead, it’s an opportunity to observe, research, and learn. Here’s why FCX is a fascinating case study and what to watch for.
Why FCX Is a Great Study
1. **Dividend Catalyst (Jan 15)
- Watching the stock’s behavior leading up to and after the ex-dividend date could give insights into how investors value the dividend.
- Track whether the stock trades with increased volume or volatility as traders position themselves to collect the dividend.
2. **Earnings Catalyst (Jan 23)
- With earnings just a week after the ex-dividend date, you have a rare overlap of events that could amplify price movement.
- Depending on sentiment, the stock could rebound from the ex-dividend price drop—or face additional pressure if earnings or guidance disappoint.
3. **Copper Exposure
- FCX is already on our radar for its ties to EVs, renewable energy, and infrastructure projects.
- Broader copper demand, influenced by economic sentiment or supply chain news, could add another layer of movement to this stock.
What to Watch
1. Pre-Dividend Price Action (Now through Jan 14)
- Look for increased buying as traders position for the dividend.
- Monitor volume trends and whether FCX breaks key technical levels.
- Keep an eye on market sentiment and copper-related news.
2. Ex-Dividend Price Adjustment (Jan 15)
- Observe if the stock drops by exactly the dividend amount ($0.15) or if external factors cause a different adjustment.
- Watch for recovery post-drop—does buying interest resume, or does the stock stall?
3. Earnings Anticipation (Jan 16–23)
- Monitor implied volatility (IV) for options, as IV typically rises before earnings.
- Consider how copper prices or macroeconomic trends (like China reopening or U.S. infrastructure spending) might affect sentiment heading into earnings.
4. Post-Earnings Reaction (Jan 23 and Beyond)
- Listen to the earnings call for insights on copper demand, production costs, and forward contracts.
- Note whether the stock aligns with broader copper and EV trends or diverges based on the results.
Possible Outcomes
1. Bullish Scenario
- Dividend buying drives interest, and earnings provide a strong catalyst for growth.
- The stock rebounds quickly after the ex-dividend date and continues upward momentum post-earnings.
2. Bearish Scenario
- Dividend adjustment leads to further downside pressure, and earnings fail to meet expectations.
- The stock underperforms compared to copper peers.
3. Neutral Scenario
- Dividend adjustment happens as expected, and earnings provide no surprises.
- FCX trades sideways, maintaining a range-bound pattern.
How to Track and Document
1. **Price & Volume:**
- Record closing prices from now through Jan 23.
- Note volume spikes and their timing relative to events.
2. **Options Activity:**
- Monitor the options chain for changes in implied volatility as earnings approach.
- Look for unusual activity around certain strikes or expirations.
3. **Copper Prices:**
- Track global copper prices, as they could influence sentiment for FCX.
4. **News Flow:**
- Stay updated on copper demand, EV adoption, and infrastructure-related headlines.
A Practical Exercise in +EV Thinking
FCX presents a unique opportunity to explore the layered dynamics of dividends, earnings, and macroeconomic trends. Even if you don’t take a position, tracking these events can sharpen your understanding of how catalysts play out in real time.
And, of course, this study aligns perfectly with the philosophy behind my upcoming eBook and print guide:
**“Adding to Your Nest with EV in 2025 – A guide for researching the hidden gems in the EV market sector of trading.”**
So, can we get +EV from EV? The answer lies upstream, in the copper that holds everything together.
-Bob Cavin 3

$FCX - Potential trendline bounceNYSE:FCX is getting close to checking back the uptrend line. In the past, the trendline has provided reliable support.
If the trendline fails to provide support, it could drop to the $37 to $36 area, which would be an ideal entry point.
Knowing that, what would you do? Enter at the trendline checkback or wait for the trendline to break?
As always, I share my opinions and trades. I'm not suggesting that anyone follow my trades. You do you.

$FCX with a bullish outlook following its earnings #StocksThe PEAD projected a bullish outlook for NYSE:FCX after a positive over reaction following its earnings release placing the stock in drift B with an expected accuracy of 63.64%.

FCX Freeport-McMoRan Options Ahead of EarningsAnalyzing the options chain and the chart patterns of FCX Freeport-McMoRan prior to the earnings report this week,
I would consider purchasing the 50usd strike price Calls with
an expiration date of 2024-11-15,
for a premium of approximately $1.49.
If these options prove to be profitable prior to the earnings release, I would sell at least half of them.

Gold Mining Coming Up??NYSE:FCX
With the option Flow coming in this gave us a bullish bias on the stock. After the trader placed his trade the markets drove the stock down which is max pain. The quicker the market maker drives the stock against the trader, the higher the chance of the trade going in their direction. While going through NYSE:FCX 's option chain we have 2 major put walls, the $40 and $40.5 strike giving more of a reason to move the stock higher. For the technicals the stock created a technical bottom and a liquidation bottom indicating the stock is ready to move higher!

Freeport in Freefall?Freeport-McMoRan has struggled since the spring and some traders may see risk of further declines.
The first pattern on today’s chart is the series of higher highs and higher lows since early August. The copper miner fell through the bottom of that channel on Tuesday, creating a potential bear-flag breakdown.
Second is the zone around $43.30. It was a high in December and important breakout level in March. FCX recently tried to hold this support area but yesterday tore through it.
Third, the breakdown is occurring around the 200-day simple moving average. That may suggest that a longer-term uptrend is ending.
Speaking of the long run, the price action between April and July could be viewed as a top. Not only did FCX fail to break above its 2022 peak. It also formed a potential head-and-shoulders reversal pattern.
TradeStation has, for decades, advanced the trading industry, providing access to stocks, options and futures. See our Overview for more.
Past performance, whether actual or indicated by historical tests of strategies, is no guarantee of future performance or success. There is a possibility that you may sustain a loss equal to or greater than your entire investment regardless of which asset class you trade (equities, options or futures); therefore, you should not invest or risk money that you cannot afford to lose. Online trading is not suitable for all investors. View the document titled Characteristics and Risks of Standardized Options at www.TradeStation.com . Before trading any asset class, customers must read the relevant risk disclosure statements on www.TradeStation.com . System access and trade placement and execution may be delayed or fail due to market volatility and volume, quote delays, system and software errors, Internet traffic, outages and other factors.
Securities and futures trading is offered to self-directed customers by TradeStation Securities, Inc., a broker-dealer registered with the Securities and Exchange Commission and a futures commission merchant licensed with the Commodity Futures Trading Commission). TradeStation Securities is a member of the Financial Industry Regulatory Authority, the National Futures Association, and a number of exchanges.
TradeStation Securities, Inc. and TradeStation Technologies, Inc. are each wholly owned subsidiaries of TradeStation Group, Inc., both operating, and providing products and services, under the TradeStation brand and trademark. When applying for, or purchasing, accounts, subscriptions, products and services, it is important that you know which company you will be dealing with. Visit www.TradeStation.com for further important information explaining what this means.

$FCX: Bullish Reversal Signal with Economic TailwindsFreeport-McMoRan (FCX) Analysis: Bullish Signals Amid Economic Shifts 📊🔍
#YUSUKE_ALERT 🏭 NYSE:FCX : Bullish Momentum Building Alert Details: Option: 08/30/24 $45.5C
Yusuke
Aug 16, 2024
Freeport-McMoRan (FCX) Analysis: Bullish Signals Amid Economic Shifts 📊🔍
Recent Price Action 📈
Freeport-McMoRan (FCX) has shown significant bullish momentum, closing at $43.58, up 3.98% in the most recent session. This price action suggests a potential reversal from the recent downtrend, aligning with broader economic indicators.
Thanks for reading Kevin’s Substack! Subscribe for free to receive new posts and support my work.
Subscribed
#YUSUKE_ALERT 🏭 NYSE:FCX : Bullish Momentum Building
Alert Details:
Option: 08/30/24 $45.5C
Ask: 152 contracts @ $0.56 ($9K total)
Vol/OI: 301/52 (5.79 ratio)
Time: 08/15/2024 @ 10:15:30am
Technical Analysis:
Daily Chart:
FCX closed at $43.58, up 3.98%
Bounced off support at $40.68 (PT3)
Above 21-day moving average
Next resistance levels: PT1 $45.44, PT2 $46.37, PT3 $48.03
Weekly Chart:
Bullish engulfing candle forming
Key resistances: PT1 $46.37, PT2 $51.03, PT3 $51.97
Monthly Chart:
Long-term uptrend intact
Major resistances: PT1 $51.97, PT2 $53.15, PT3 $55.24
Actionable Signals:
🎯 Entry: Current price ($43.58) or pullback to $42.50
🛑 Stop Loss: Below recent low of $40.68
🚀 Targets:
Short-term: $45.44 (PT1 on daily)
Medium-term: $46.37 (PT2 on daily, PT1 on weekly)
Long-term: $48.03+ (PT3 on daily)
📊 Volume Confirmation: Watch for increased volume to support bullish move
🔍 Key Breakout Level: $45.44 (PT1 on daily) - a break above this level with volume could signal stronger bullish momentum
Risk Management:
Position sizing: Consider limiting risk to 1-2% of trading capital
Scaling: Enter partial positions and add on confirmed breakouts
Trailing stop: Adjust stop loss as price moves in your favor
Remember, this alert shows bullish options activity, but always conduct your own due diligence and consider broader market conditions before trading. The copper market and global economic factors can significantly impact FCX's performance.
Technical Analysis 🔬
Daily Chart
FCX has bounced off the support level around $40.68 (PT3)
Currently trading above its 21-day moving average, indicating short-term bullish momentum
Key resistance levels to watch:
PT1: $45.44
PT2: $46.37
PT3: $48.03
Weekly & Monthly Outlook
Bullish engulfing candle on the weekly timeframe
Long-term upward trend intact on monthly chart
Fundamental Catalysts 🌟
Image
Copper Demand Surge 🚀: Copper prices are at their highest since mid-2022, driven by:
Improving economic conditions in China and the US
Long-term energy transition trends (EVs, renewable energy infrastructure)
Image
Supply Constraints ⛏️: Recent geopolitical issues and mine closures have tightened supply, potentially supporting higher prices
New Indonesian Smelter 🏭: FCX's subsidiary PT-FI has commenced commissioning of its new Manyar smelter, positioning the company for integrated production in Indonesia
Financial Outlook 💰
Q2 2024 sales expected to be lower than initial guidance due to export license delays
Consolidated unit net cash costs for Q2 2024 estimated at $1.77 per pound, up from previous $1.57 estimate
2024 gold sales forecast adjusted to 1.8 million ounces from previous 2.0 million ounces estimate
Full-year 2024 copper volume guidance expected to remain largely unchanged
Economic Conditions & Rate Cut Impact 🌐
As the Federal Reserve contemplates potential rate cuts, FCX could benefit in several ways:
Increased Demand 📈: Lower rates typically stimulate economic activity, potentially boosting demand for copper and other metals
Cheaper Financing 💳: Reduced borrowing costs could support FCX's capital expenditure plans and operational expansion
Currency Effects 💱: If rate cuts weaken the USD, it could make FCX's products more competitive in international markets
Investor Sentiment 🤔: Rate cuts often boost risk appetite, potentially driving more investment into cyclical stocks like FCX
🚨 #YUSUKE_ALERT 🚨
NYSE:FCX : Bullish Reversal Signal with Economic Tailwinds
Entry: Current price ($43.58) or on a pullback to $42.50
Stop Loss: Below recent low of $40.68
Targets:
$45.44 (short-term)
$46.37 (medium-term)
$48.03 (longer-term)
Actionable Signals:
Break above $45.44 confirms bullish momentum
Watch for increased volume to confirm trend
Monitor copper prices and broader economic indicators
Remember, while the outlook appears positive, always conduct your own due diligence and consider your risk tolerance before making any trading decisions. The interplay between FCX's operational developments, copper market dynamics, and broader economic shifts will be crucial to watch in the coming months. 🔍📊
Thanks for reading Kevin’s Substack! Subscribe for free to receive new posts and support my work.
Subscribed

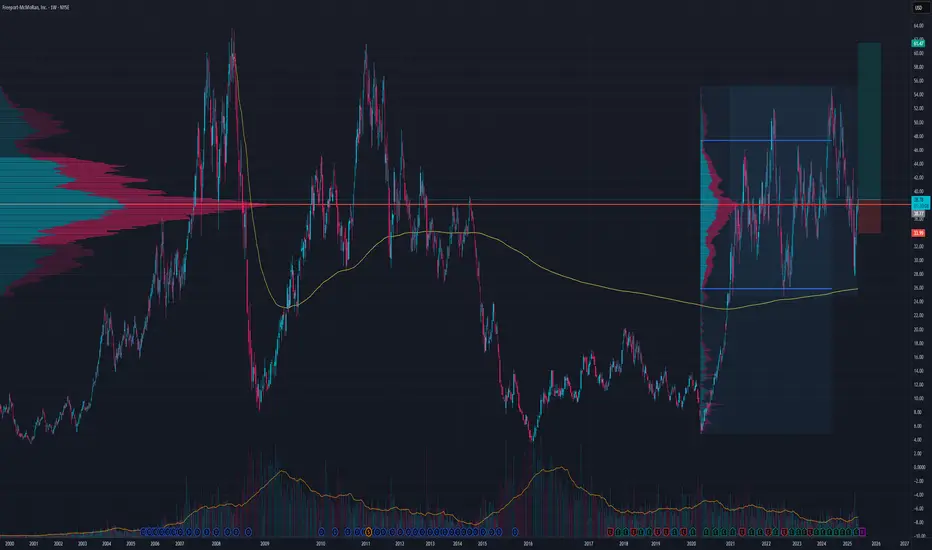
FCX ConverterAnother project that was developed a while ago, before it even got near the green. 2 interesting coincidences qualify it for a share where we can see if it keeps on giving...
My favorite path is the descending one highlighted with the curve/arc, but having an open mind for any type of inflection, in any position or direction, but preferably at any of the marked zones.

Technical Analysis of Freeport-McMoRanLong Position
Entry Point: Consider entering a long position if the stock breaks above the resistance level of $51 with significant volume.
Price Target: Initial target at $55.98 (11.80% upside), with a potential extension to $60 if the bullish momentum continues.
Stop Loss: Place a stop loss below the recent support level at $47 to mitigate downside risk.
Short Position
Entry Point: Consider a short position if the stock falls below $48, indicating a break of the consolidation phase on the downside.
Price Target: Short-term target at $45, with a possible further decline to $42 if bearish momentum gains strength.
Stop Loss: Place a stop loss above the resistance level at $51 to protect against a potential bullish breakout.
The MACD level is positive at 0.21, suggesting bullish momentum.
Stochastic RSI: At 58.78, it remains neutral but is edging closer to the overbought territory, indicating potential for a slight upward move before any significant correction.
Commodity Channel Index (CCI): Neutral at -8.41, showing no significant overbought or oversold conditions.
Given the current neutral stance of various technical indicators, the market seems to be in a wait-and-see mode. Investors should keep a close watch on upcoming earnings reports and any significant news in the commodities market, particularly concerning copper and gold prices. A breakthrough in either direction from the current consolidation range could provide a clear trading signal.

Freeport-McMoRan Inc. (FCX)The daily chart reveals a bullish engulfing pattern, suggesting a potential reversal of the recent bearish trend. Closing at $48.71 with a 0.62% increase, this pattern is a strong indicator of upward momentum, particularly as it appears near support levels.
The Ichimoku Cloud analysis indicates that FCX is currently within the cloud, signaling a phase of consolidation. The narrowing future cloud suggests an impending breakout. The Kijun-Sen (red line) hovers slightly above the Tenkan-Sen (blue line), highlighting weak bearish sentiment. A decisive close above the cloud resistance at $50.23 would confirm a bullish breakout.
RSI: Currently at 45.25, the RSI suggests a neutral stance. A rise above 50 would indicate increasing bullish momentum, while a drop below 30 would denote oversold conditions.
MACD: The MACD at -0.55 remains in the sell zone, with the MACD line below the signal line. A crossover above the signal line would be a bullish sign.
Momentum: At 1.45, the Momentum indicator shows a buy signal, pointing to growing positive momentum.
Recent news about Freeport-McMoRan securing significant permits for its Indonesian operations adds a positive catalyst. This development could bolster investor confidence, potentially driving the stock higher in the near term.
Long Position
Entry Point: $49.00 (confirming a breakout above 20-day EMA and cloud resistance)
Target: $52.31 (R1 pivot level)
Stop Loss: $47.50 (below 100-day EMA)
Short Position
Entry Point: $47.50 (if the stock fails to hold above 100-day EMA)
Target: $45.73 (S1 pivot level)
Stop Loss: $49.50 (above recent resistance)
Freeport-McMoRan Inc. (FCX) exhibits signs of a potential bullish breakout, bolstered by technical indicators and recent positive news. Traders should watch for a move above key resistance levels and confirm bullish momentum before taking long positions. Conversely, failure to break these levels could warrant short positions. Adhering to precise entry and exit points, along with appropriate stop-loss measures, will be crucial in navigating FCX’s market movements.

FCX | Copper Companies Look Good | LONGFreeport-McMoRan, Inc. engages in the mining of copper, gold, and molybdenum. It operates through the following segments: North America Copper Mines, South America Mining, Indonesia Mining, Molybdenum Mines, Rod and Refining, Atlantic Copper Smelting and Refining, and Corporate and Other. The North America Copper Mines segment operates open-pit copper mines in Morenci, Bagdad, Safford, Sierrita, Miami in Arizona and Chino, and Tyrone in New Mexico. The South America Mining segment includes Cerro Verde in Peru and El Abra in Chile. The Indonesia Mining segment handles the operations of the Grasberg minerals district that produce copper concentrate containing significant quantities of gold and silver. The Molybdenum Mines segment includes the Henderson underground mine and Climax open pit mine, both in Colorado. The Rod and Refining segment consists of copper conversion facilities located in North America and includes a refinery, and rod mills. The Atlantic Copper Smelting and Refining segment smelts and refines copper concentrate and markets refined copper and precious metals in slimes. The Corporate and Other segment offers other mining and eliminations, oil and gas operations, and other corporate and elimination items. The company was founded by James R. Moffett on November 10, 1987 and is headquartered in Phoenix, AZ.


FCX1Y
RSI is trending down.
MFI is relatively stable sitting between the 25 and 75 range.
5Y
RSI is low and almost oversold.
MFI is trending down.
ALL
RSI is falling.
MFI is falling.
There are gaps around $5-$6.
Prediction: The indicators are bearish. We will fall towards the $5-$6 range.
For my educational purpose, not to be used as financial advice.
