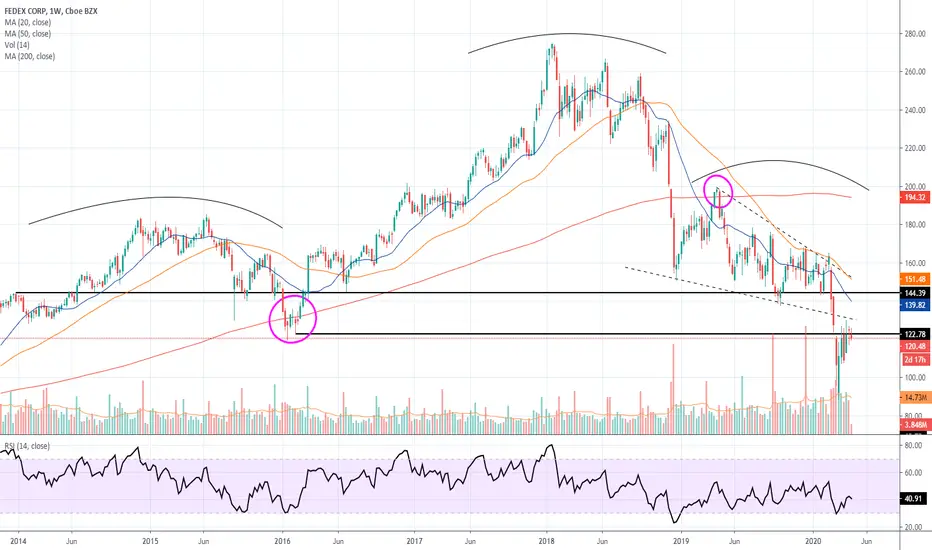
FDX loves the 200 EMA Zoom out further and see, best to wait for a retest and then direction before entering
FDX trade ideas


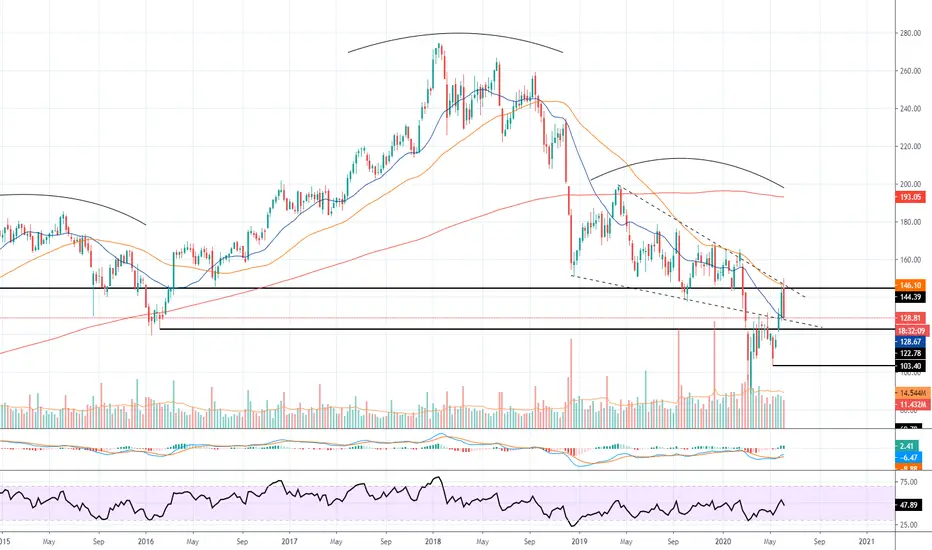
$FDX and the importance of not trying to catch a falling stockI decided to go with the weekly chart because the daily chart has become so tricky and noisy. I have seen so many people trying to convince other to buy FedEx even when the stock has an amazing strength in the downside. However, Fedex is a company with a long history and that makes most of people that it has to go up soon or later, well that's not the best argument to buy FedEx, just remember that General Electric is now around -70% from the ATH, 19 years ago. So it's so much better if you just wait for a real important support because buying right now is a bad idea, the general market is falling, FedEx is not a stock with realative strength, it is a stock damaged before the coronavirus.
Let's go the important points of possible entry and with very defined points of exit. The first important buying point is 120.91- 120.30 a support since May 2006 and tested many times Feb 2007, July 2007 and January 2016. Your possible next entry will be 112.24 with a stop loss at 99.75 wich will be your last point of a possible buying. Another good sign are the divergencies of MACD and RSI.Once again you should follow the price and entry and exit points very defined and not go trying to catch it just because is down 50%, take into account that the market is in a correction and with risk to get into a bear market, and if the market keeps with this volatility, what is least convenient for you is to be blocked with an action that is unable to increase in price and with a high exposure to decrease its value.


Fedex. Triple bottomOn the weekly TF, the “triple bottom” reversal formation is visible, the profit for which is around 19%, the formation is supported by convergence of senior TFs (month and 2 weeks).
I will try to buy at the prices pass above $ 125 (breakdown point on the figure)
Stop - the price will fall below $ 125
Profit 1 - $ 141 (MA200 day + level)
Profit 2 - area of $ 160, if the price can overcome MA200
convergences
triple bottom


FDXPosted this chart back on March 9th. Bear flagging right into previous support now after completing a head & shoulders. Weekly 200 sma acted as resistance back at the beginning of 2016 but turned to resistance at the end of 2019. Price tested the 20 & 50 weekly smas multiple times but couldn't get through & buyers eventually gave up. As long as price remains below $123, I think we see $70. Good low risk entry here.

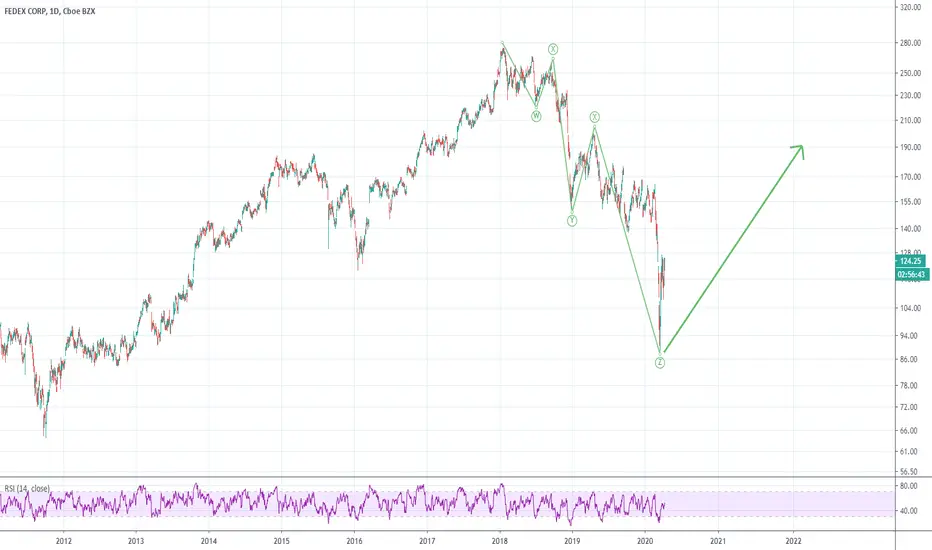
Technical looks Good to go HigherThere is not much to comment on besides the obvious trend reversal that is taking place on the chart.
FDX could see competition from Amazon in the far future. In the mean time, Amazon's immediate misfortune is FDX's gain.
It is difficult to predict how high this will go or if the current uptrend is just a deadcat bounce. Nonetheless, this is a good entry point at $125. Any dip below $125 right now is a buy.


FDX prepare to long when re-test demand zone AT 96.5 (under 100)Waiting for re-test the demand zone to form a double bottom. Demand Zone 94 - 96 (6/24/2013 )
Use confirmation trading plan:
Price must down below 96.5, and should not close below 95.5, the low should not go down below 94.
When it goes up back to 96.5, use stop order or market order buy. If it will Gap up and not above 100.5, market order buy at open.
Stop: 93.95
Target1 is 120; Risk/Reward: (96.5-93.95=2.55)/(120-96.5=23.5)=1:9
Target2 is 140; Risk/Reward: (96.5-93.95=2.55)/(140-96.5=43.5)=1:17
If Gap up, market order buy before 100.5: Risk/Reward: (100.5-93.95=6.55)/(120-100.5=19.5)=1:3 -- "1:3" is the basic Risk/Reward ratio,otherwise it is not a good plan.
Check following Gaps:
G1: if the down trendline will be broken by a Gap, that shows the beginning of a new trend.
G2: if a Gap could jump above the 120 supply zone, that shows the trend is in middle, there is another 50% to 60% range after this Gap. we don't need to close this position, we just need to move stop below target1.
G3: if there is Gap into the 140 supply zone, that shows the trend near end. This will be an exhausted Gap. we need to close this position.
If we will see these Gaps, or one of them, that could be used to estimate the trend range, and to verify the trend strength.


