Long Ford $FFlag is done, growth with volumes, Long term trend improved, golden cross = goal as take profit at 16 looks easy to reach.
FORD trade ideas


Market Manipulation, a Conspiracy theory or a Provable fact?Those who run this show using the same technique over and over to benefit from beginner traders' sense of FOMO..!
They are ready before the news comes out already bought their options, and run the show.
look at other examples:
1- NYSE:SPCE
2- NYSE:RBLX
The price pattern and the Price*Volume patterns are very identical..!

F - long term holdFord looks great both technically and fundamentally. Breaking out on volume
With all good news in EV sector it's a long temr hold for me (= no stop loss)


Ford - Down to $12 for Support!-Wall Street has high expectations for Ford Motor’s first investor day under CEO Jim Farley on Wednesday.
-The company’s stock price has roughly doubled since Farley took control of the company on Oct. 1. That includes a 12.6% increase last week after the debut of the company’s new electric F-150 Lightning pickup truck.
-Investors will be watching the highly anticipated investor event to see if Farley can keep up the momentum. He has promised to provide details his management team’s direction for the automaker.
-Farley’s predecessor, Jim Hackett, was criticized by Wall Street for failing to detail his turnaround plan and having an unclear vision to fix Ford’s operations. Farley’s plan will have to be detailed to appease Wall Street.
-“Since Jim Farley has taken over as CEO, Ford has promised increased transparency and measurable so we can track Ford’s progress and execution,” RBC Capital Markets analyst Joseph Spak said in a note. “We expect those, along with financial targets, to be detailed at the event.”
-One of the main targets analysts want to see is a long-promised 8% global adjusted profit margin target, including 10% in North America and 6% in Europe. The 8% was promised by Hackett as well as his predecessor, Mark Fields, as part of a “2020 vision” that never happened.
-Before the coronavirus pandemic, Ford’s adjusted profit margin was 4.1% in 2019, followed by 2.2% in 2020. Due to an imbalance of supply and demand in new vehicles due to an ongoing global semiconductor chip shortage, it was inflated to 13.3% during the first quarter of this year.
-For comparison, General Motors’ adjusted profit margin was 6.1% in 2019, 7.9% in 2020 and 13.6% during the first quarter of this year.
Wells Fargo analyst Colin Langan expects Ford to reaffirm its long-term margins at the event, and mostly focus on the “future mobility themes” such as electric and autonomous vehicles and data monetization.

F 1HRBULLISH Deep Crab
price need to follow Green Trend line & hit target
If price Breaks Red Trend line is where EXIT before SL hits
POTENTIAL BUY
F 4HRBULLISH BAT
price need to follow Green Trend line & hit target
If price Breaks Red Trend line is where EXIT before SL hits
POTENTIAL BUY

$F - multi-year down trend break out target $16 Ford is at a very strong resistance. A break above $13.60 could propel the stock to $16.
Best case is $18.
———————————————————
How to read my charts?
- Matching color trend lines shows the pattern. Sometimes a chart can have multiple patterns. Each pattern will have matching color trend lines.
- The yellow horizontal lines shows support and resistance areas.
- Fib lines also shows support and resistance areas.
- The dotted white lines shows price projection for breakout or breakdown target.
Disclaimer: Do your own DD. Not an investment advice.


Ford Breakout? 1 week chart of Ford motor company. Recently broke out of 7 year parallel channel and broke 20 year resistance trend line. If Ford can break and close 13.60 it will test the double top at 18. It can break 18 it should test ATH from all the way back in 1999. Note recent volume spike which gives the move conviction.

FORD MTR Daily Bat Bearish
VERTICAL DOTTED LINE is Ultra high volume up bar
Higher volume- Professionals are selling into the public buying
SET UP BECOMES VALID ONLY when RSI is below 70 and IF Price breaks ULTRA HIGH VOLUME Candle LOW &
Within 3-5 price bars need the confirmation from a BEARISH CANDLE with LOW VOLUMES & with NO DEMAND
POTENTIAL SELL

Ford's future seems brightRecently they've taking the electric cars seriously which a huge boost to them and to their market share
The ascending trend of the stock has been confirmed for a whike trading in an ascending channel
If you have it in your postfolio it is to be kept for the time being thhe uptrend is going strong
If you don't add it to your watchlist and wait till it hit the support line for a safe entry point

naked long call option on Ford breaking out from 8 yr downtrendExpiration: 9/17/2021
Strike Price: $13.00
Max Loss: $103.00
Max Gain: Unlimited
Breakeven: $14.03


Let's see what is gonna happenIf we manage to hold the 12,09 support or even the 11,89 level (worst case), then the outlook will remain bullish .
In the opposite case, we might head downwards.
Next support: 11,28
Next resistance: 12,33

$F Ford looking pretty solidIs it just me or Ford looks pretty attractive right now???
Contemplating here..
Timeline ~ 15 months out (Oct/Nov 2022)
PT -- 2-3x current price of $11.50-12
Thoughts?

Ford looks to have broken out of long term downtrendFord looks to have broken out of a long term downtrend.
I lean towards a retest of the $8.88-7.22 region before the bull market really starts.
Regardless, looks like a great long from these levels.

Ford Lightning Re,Chants for Returning of Dividend NYSE:F is revealing the much anticipated F-150 Lightning on May 19th.
Elon Musk and NASDAQ:TSLA are not EV in North America. I think NYSE:F is the future of EV in North America.
With bearish trend towards EV and anything chip heavy, retail will be shopping for a seasoned manufacturer of North American vehicles to lead EV.
This would be a great opportunity to predict NYSE:F returns its dividend because of Biden's capital gains tax proposal that excludes dividend income.


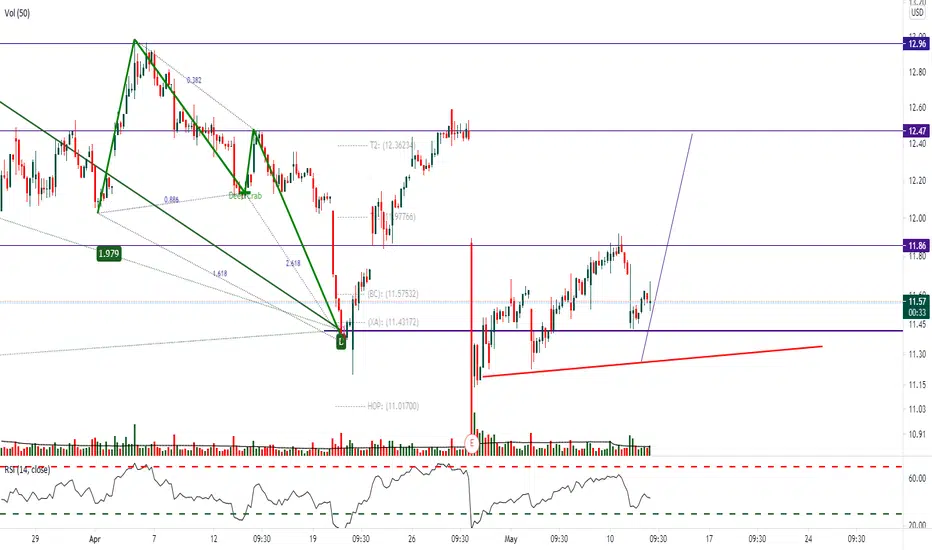
Ford near resistance at 12Getting close to the resistance at $12. We've been in a small 20 cent range since Apr 29th. If we can break out of here I will be targeting the high from the week of Apr 26 which is $12.60. So far it looks like it will just bounce down but I'm keeping an eye on it in case it breaks through. If there's a move I will probably use the 12 calls with at least a couple weeks of time.

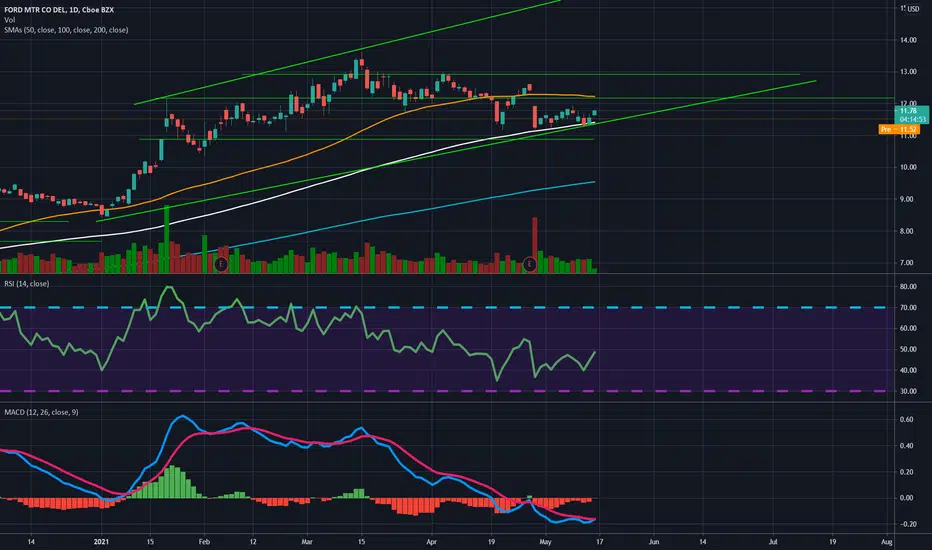
Ford uptrend channel. Ford daily chart shows a uptrend channel that looks very promising. The chip shortage wont last long and they are addressing the issue as we speak. RSI is heading up while the MACD looks ready to close red and turn green. Look how it is using the 100 sma line as support and it also assembles a ascending triangle. Dont sleep on Ford.