GEGE at the bottom of the range showing hidden bullish divergence on both macd and rsi
right at the 200 moving average
could see nice swing up in price towards top of the range
GE trade ideas

These patterns can make GE fly to the $13.90! 👀We are in a consolidation, and the 13.19 is a ceiling for GE, while the 12.94 is a floor. According to Al Brooks, 80% of the breakouts are going to be false, so we must be careful.
The time to buy is near the support, but there’s a chance we’ll see a breakout from the 13.19.
We have a possible advanced breakout in the 4h chart, and if confirmed, this can make GE fly and close the gap around 13.90.
This is something that favor the buyers, but again, let’s wait for the confirmation on the price action! Also, the 20ma is right there above us, so, we must see a good breakout as soon as possible.
If you liked this trading idea, remember to click on the “Follow” button to get more trading ideas like this, and if you agree with me, click on the “Agree” button 😉.
See you soon,
Melissa.

Long GE with good upside potentionCan initiate a long swing trade on GE if the close offers a good RR ratio of more than 2.5.

Bullish on General electric. GELatest set of zigzags seem like a whole bunch of flats taking up quite a bit of fibtime. This is classical of a Wave 4. A careful count confirms this at an eagle eye view. If that assessment proves to be true, then we have one more move up, and given the moves already made, it might be quite a big one comparatively.
Fibonacci goals are in green, reversal or invalidation is in red. This post is not financial advice, make your own financial advice or pay a certified professional ( you are to statistically faire better at blindly longing SnP500 incase of the latter). Playing on the market whether you are an investor or a trader is risky. No good thing is ever without. Good luck out there.


SHORT idea on GE. SHORT idea on GE. Playing the Volume profile gap and FIBs. This is not financial advice and if you're taking financial advice from me I also have some real bitcoins for sale and they come in a pack of 12.


Time to blow off the roofWe had a huge run-up on 27th of May.
I believe it will have a nice continuation, but the price needs to sonsolidate for a while first.
I will enter when the RSI will be oversold on the hourly timeframe and around 13,75-13,40.
The overall picture looks very bullish to me.

GE - Great Week for GE ⚡-GE Stock Is Having a Great Week. Thank Airbus.
-An improving commercial aerospace business appears to be the reason for recent gains. On Thursday, Airbus (AIR.France) announced plans to increase output of its A320 family of jets. The European airframe assembler says it will build 45 jets a month by the end of 2021, up from about 40 jets a month now.
-The big news for GE though is Airbus’s target of building 64 jets a month by 2023. That is a big increase, and signals that Airbus believes commercial air traffic will continue to recover. Air traffic in the U.S., over the past week, is still down about 30% from prepandemic 2019 levels. But that actually is an improvement from recent months, and traffic is up about 480% year over year.
-GE makes engines for both the A320 and Boeing ‘s (BA) 737 families of jets through its CFM joint venture with Safran (SAF.France). Safran stock is also seeing gains, rising about 3% for the week and trading just below a 52-week high.
-Boeing is also looking to boost 737 MAX production rates in coming months, while also delivering some of the MAX inventories that were built while that plane was grounded worldwide between March 2019 and December 2020.
-The increased output from Airbus—and Boeing—helps more than just GE and Safran; all aerospace suppliers benefit. Shares of Raytheon Technologies (RTX), Honeywell International (HON), and Woodward (WWD), for instance, all rose roughly 3% to 4% this week. The S&P 500 is up about 1.4%.

GE long over 14.44GE looks good for a long above 14.44 if we can get another 1 / 2 days of consolidation here


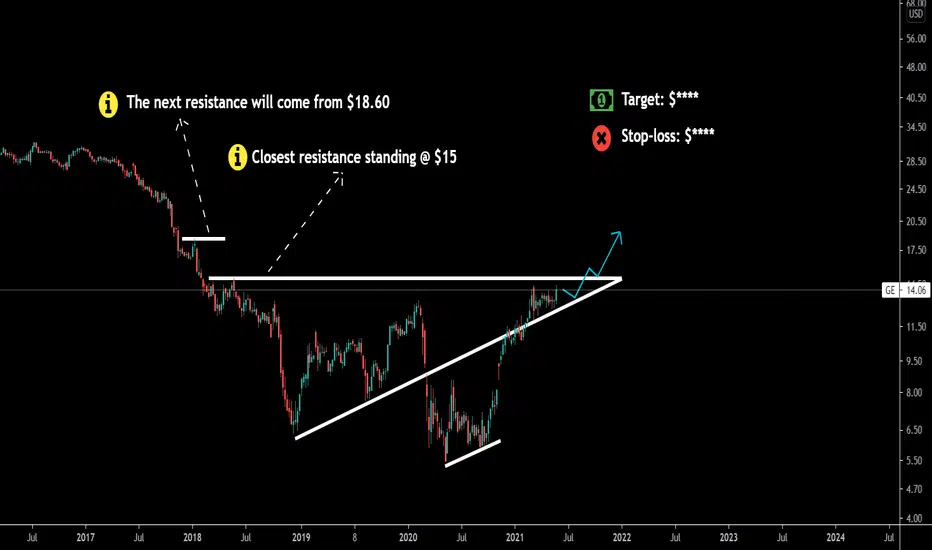
$GE - Good case $16, Best case $21Cup & Handle base break out.
Target 1 - $16
Target 2 - $21
———————————————————
How to read my charts?
- Matching color trend lines shows the pattern. Sometimes a chart can have multiple patterns. Each pattern will have matching color trend lines.
- The yellow horizontal lines shows support and resistance areas.
- Fib lines also shows support and resistance areas.
- The dotted white lines shows price projection for breakout or breakdown target.
Disclaimer: Do your own DD. Not an investment advice.


#GE - 1D - LOOKING GREATAfter a massive uptrend ride, GE took a break during the past two months leaving a clear bullish pennant.
MACD its looking gorgeous right now.
- OPPENING POSITION: 13.5
- STOP LOSS: 12.75
- TAKE PROFIT: If we are thinking on a swing trade, 14.40 (+7.6%) would be a decent profit. But, I believe that its a great position for a long term. Lets check once we reach our first target if technical indicators validate this idea.

GE - GREAT Short Opportunity, IF ... !!Hello! Friends,
- This would be a great short Opportunity, IF NYSE:GE breaks down the Daily Support line at $13.16 ( with a WHOLE DAILY Candle ) !!

General Electric, huge potential If it surpasses the resistance at $13 and breaks out, it would have a clear path to $20. In the long run it still has room to climb. To be worth it, I recommend going with leverage. At the current price, a tight stop loss is relatively "safe" as I don't see it falling further.
NYSE:GE

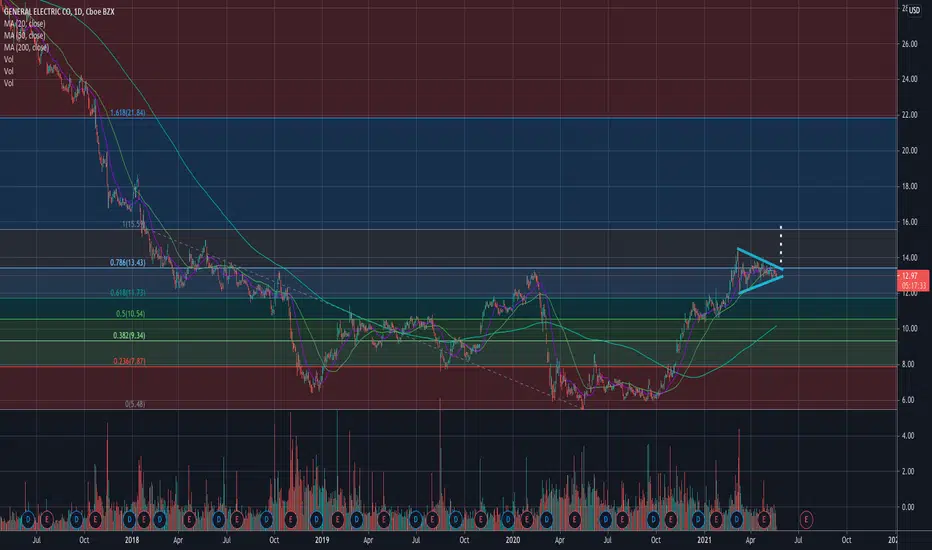
$GE - Coiling for a breakout. Target $16Symmetric triangle breakout above 13.43 could propel $GE to $16.
———————————————————
How to read my charts?
- Matching color trend lines shows the pattern. Sometimes a chart can have multiple patterns. Each pattern will have matching color trend lines.
- The yellow horizontal lines shows support and resistance areas.
- Fib lines also shows support and resistance areas.
- The dotted white lines shows price projection for breakout or breakdown target.
Disclaimer: Do your own DD. Not an investment advice.
$GE General electric a little risky climb to exploitMy advisor Marketmiracle has generated a signal of purchase on the stock General electric to the price 13,06 with a target 13,50 with a potential profit of 3,37%
the signal is supported from a trendline of along course that is supporting the prices and from the interest of the great investor on the Stock that is increasing ( yellow wave )
Considering the low risk it could be an opportunity to take home a small profit.
This idea is based on a signal generated by the advisor Marketmiracle, down on this page you will find the link to the page of signals of the advisor that you can see for free without any cost or registration

General Electric Short SetupOn the long term chart we have had two prior reactions at this price level which represents strong resistance.
In the short term we have broken down out of a triangle consolidation pattern which offers a good risk reward entry point for a bearish position

GE close to a breakoutGE is getting close to a breakout. We need volume to start picking up here to confirm the up move. So far its just OK, but the options are cheap so it wouldn't take much for exposure to a move. The short term play I'm looking at are the 13.5 calls for June 11th or 25th. Long term I'm interested in the 15 calls for Jan 22.

General Electric is looking ready for another leg upNYSE:GE is looking bullish and ready for another leg up, the stock formed a pennant pattern and is about to break out. Long the break out, targets and anticipated price action is shown on the chart, stop loss at 11.9$.
Hit the like button please if you find this useful :)
This is only my own view and not a financial advice, do your own analysis before buying or selling
Happy Trading!
