Diamond in the rough !!!!!!!Galapagos NV is a European pharmaceutical research company
Legendary investor Warren Buffett advises to be fearful when others are greedy, and be greedy when others are fearful.
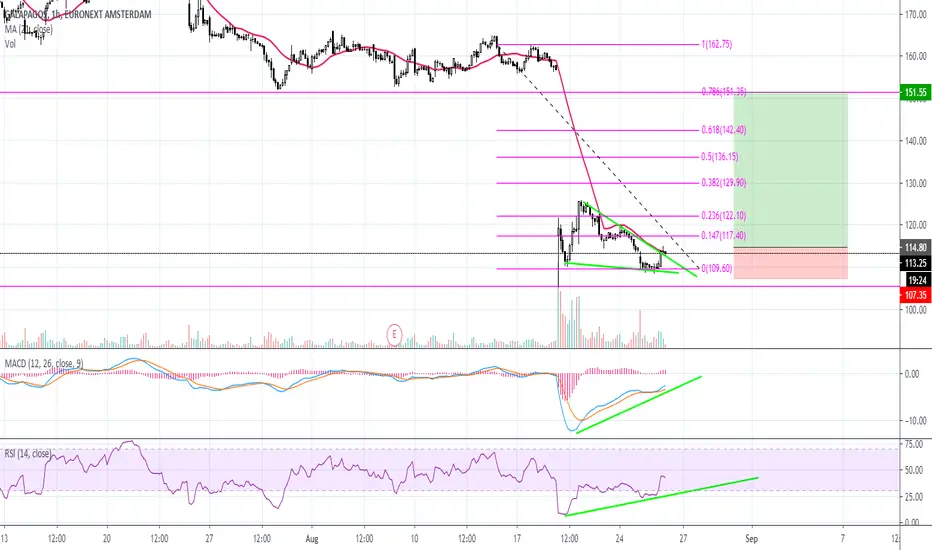
We can see that the stock is very oversold which could lead us to a good buying moment
We also see that it is respecting the resistance of 110.65 very well
We could place the SL at 107
While the TP could be at 165 (although we could let that gain run as long as we adjust our SL)
At the moment that the breakdown of the range occurs to some place it can give a strong rise or fall (we see that there is a lot of rejection in the drop)
Besides that the RSI marks a lot of oversold
Blessings to all
If the info served you, give me a like and subscribe for more purchase opportunities ;)
GLPG trade ideas

Big upside potential on GalapagosGalapagos left a big gap behind after tanking hard.
On the 1hr chart bullish divergence on the MACD and RSI has been formed and price is trying to break out of an ascending wedge.
Next thing I look at is the resistence from the 21 MA. If it can clear the MA and price finds support I will open a long position with big upside potential on closing the gap.
No advise. Im a beginner. Feedback welcome.

My view on €GLPGI'm short right now, hoping to buy in the greenzone!
Keeping an eye on the resistance at EUR200.00, EUR183.00, EUR164.50
Following every Covid-19 news i can find..


The shorting crisis with Galapagos.My predictions tell me that the whitering of Galapagos will go further to a value between 170 and 160. This will happen in a time period of around 2 months. Same as it did in October when it had suffered a withering of around €30,- in a time period of 2,5 months.
It seems that after the price of Galapagos has reached the lowest point of 160 it will begin to grow again till a growth of €40,- has been achieved in a 2,5 month period. But let's not go there right now. I got rid my shares when it reached 195 when shortly after it began its drop and I will wait until it is dropped to a more comfortable price which suits my prediction.

Galapagos - Monthly outlookWe are currently in the middle of the month and Christmas is coming. This is a quiet period and normally there will be little movement here. We can therefore conclude that the biggest moves of the month have now come to an end within a week. Assuming that the price closes around this value at the end of the month, we see a pretty good respectation around 200. This may mean that the price will first fall back to the 175 area and then, potentially, break through all time highs.
On the weekly timeframe we see that the 200 level is enormously respected. This is a strong signal that the price could fall back to the indicated 175. This does not necessarily mean that this must necessarily go there, but a correction towards that area would be very common. The moment the price lingers around 175 and creates a solid bottom, there is again a great chance of a price move up and certainly also the possibility of making a new all time high. The next publication is in February, which means that the biggest fundamental influences stay out until that time.
If you have GLPG in your portfolio you should not be surprised when the stock drops a little in the next months. That would be a healthy cycle of the market. In the short term it would therefore not be a very bad idea to sell GLPG relatively close to 200. On the medium / long-term price timeframe the 200 was your ideal target.
If you want to buy GLPG; I would wait a bit. It is not the most favorable price to get in. There are plenty of other stocks that are more attractive to buy.

Galapagos Has Peaked, Nowhere To Go But DownGalapagos announced today a large investment and a 10-year deal with Gilead $GILD. The stock gapped due to Gilead buying 10% of Galapagos at $158/share. However, when stocks gap up on investments at a premium price, they almost always fall (see $MGI, $ARWR)
An analyst at Raymond James agrees, saying he believes $GLPG stock has now fully realized his price target by achieving his core investment thesis.
As terms of the deal, $GILD has promised not to increase their stake in Galapagos for another 10 years, so a buyout is off the table


Galapagos - Short - PT: € 90I think galapagos will fill the gap. With all the EU uncertencies i think many will lock profits.
First price target: € 90
Second price target: € 80

GLPG: This is a tough one to count. But it is a top buy atStoxline. I am tracking this. Looks like wave 1 of 5 is done.

GLPG: A top buy from the Nasdaq with sub (iv) of 1 completedAnd sub (v) ready to take off with a target of $119.

Galapagos different countGalapagos different count
Can either be major correction (WXY) or finish ABC at the 50 fib level and go further up (green arrow)


XPloRR MA-Trailing-Stop Strategy Galapagos(GLPG) beats Buy&HoldLong term MA-Trailing-Stop strategy with Adjustable Signal Strength to beat Buy&Hold strategy
None of the strategies that I tested can beat the long term Buy&Hold strategy. That's the reason why I wrote this strategy (link see below).
Purpose: beat Buy&Hold strategy with around 10 trades over a period of 10 years (average of 1 trade/year). 100% capitalize sold trade into new trade.
My buy strategy is triggered by the fast buy EMA (blue) crossing over the slow buy SMA curve (orange) and the fast buy EMA has a certain up strength.
My sell strategy is triggered by either one of these conditions:
the EMA(6) of the close value is crossing under the trailing stop value (green) or
the fast sell EMA (navy) is crossing under the slow sell SMA curve (red) and the fast sell EMA has a certain down strength.
The trailing stop value (green) is set to a multiple of the ATR(15) value.
ATR(15) is the SMA(15) value of the difference between the high and low values.
The script shows a lot of graphical information:
One green area represents one trade
The close value is shown in light-green. When the close value is lower then the buy value, the close value is shown in light-red. This way it is possible to evaluate the virtual losses during the trade.
the trailing stop value is shown in dark-green. When the sell value at the end of the trade is lower then the buy value, the last color of the trade will be red (best viewed when zoomed)
the EMA and SMA values for both buy and sell signals are shown as a line
the buy and sell(close) signals are labeled in blue
How to use this strategy?
Every stock has it's own "DNA", so first thing to do is tune the right parameters to get the best strategy values voor EMA , SMA, Strength for both buy and sell and the Trailing Stop (#ATR).
Look in the strategy tester overview to optimize the values Percent Profitable and Net Profit (using the strategy settings icon, you can increase/decrease the parameters)
Then keep using these parameters for future buy/sell signals only for that particular stock.
Do the same for other stocks.
Important : optimizing these parameters is no guarantee for future winning trades!
Here are the parameters:
Fast EMA Buy: buy trigger when Fast EMA Buy crosses over the Slow SMA Buy value (use values between 10-20)
Slow SMA Buy: buy trigger when Fast EMA Buy crosses over the Slow SMA Buy value (use values between 30-100)
Minimum Buy Strength: minimum upward trend value of the Fast SMA Buy value (directional coefficient)(use values between 0-120)
Fast EMA Sell: sell trigger when Fast EMA Sell crosses under the Slow SMA Sell value (use values between 10-20)
Slow SMA Sell: sell trigger when Fast EMA Sell crosses under the Slow SMA Sell value (use values between 30-100)
Minimum Sell Strength: minimum downward trend value of the Fast SMA Sell value (directional coefficient)(use values between 0-120)
Trailing Stop (#ATR): the trailing stop value as a multiple of the ATR(15) value (use values between 2-20)
Example for Galapagos (GLPG) (Start capital: 1000, Order=100% of equity, Period 1/1/2005 to now) compared to the Buy&Hold Strategy(=do nothing):
Fast EMA Buy=12
Slow SMA Buy=39
Minimum Buy Strength=40
Fast EMA Sell=12
Slow SMA Sell=45
Minimum Sell Strength=95
Trailing Stop (#ATR)=3
Result: 3.15 times better than Buy&Hold strategy
NetProfit: 2370%
#Trades: 21
%Profitable: 71%
Buy&HoldProfit: 752%

GLPG: bullish formation / trend reversal? Euro chart:
Two-week consolidation above 38% Fib retracement line (66 Eur. level) in 18-month trend. Momentum indicators positive. Recent analyst upgrades... Look for a close above 68.5-69 to buy for a move up to high 70's. Tight stop on close below 65.

Galapagos (Euronext:GLPG)Galapagos: who dares to go long? and when are longs taking profit?
Historical price momvent in Galapagos got our attention as such all buyers in this stock are in profit. Though recents two weeks Galapagos in moving into a thight price range, and it seems to hold support and resistance ballanced around 85 euro's.
Last two weeks we have traded shorts at 85.21 (+/-0.15 cents) under 10min valid short readings.
As all higher timeframes are under bearish reading, a confirmation on such a timeframe will enable to hold overnight short position in this stock. This stock is highly depended on news and updates about "the pipeline".
Our team is aware of the risk and we will hedge our position via out of the money options.
In conclusion we are neutral on Galapagos and as nearing date A we will turn to be bearish in this stock.
Therefore:
This stock is under continuous screening for time&price allignments via our inhouse developed mathematical and statistical models. Traded via ProRealtime Software.
Expected backtested hitratio of this system is higher than 75%.
Best to your trading!
With kind regards,
Trading Ecology
Trading natural patterns unnaturally perfect
Follow us on twitter @TradingEcology
Follow us on Facebook
