HD Bullish Divergence on the Daily 3.5 to 1 Ratio 15-25% moveHD now with a bullish divergence is set up for a run to its last previous high. 15-25% run on a 1 to 3.5 Risk Reward.
by iCantw84it
03.15.22
HD trade ideas

HOME Depot It can go up!The stock shows good growth, if the breakdown of the inside bar does take place, there are great chances that we will be able to see a new maximum in the future of 1-2 months.
Stop for a minimum price of the bar. Take profit to the previous maximum.
Good luck Home Depot!

Home Depot Long after the SupportThe price is right now at the support at 318 we need to see if it rises from here. If it does then buy at 335 to be sure that the trend is bullish. Stop loss and T/L according to your risk/profit ratio.


Home Depot packing up and going home. HDImmediate targets 345, 325. Invalidation at 458.
We are not in the business of getting every prediction right, no one ever does and that is not the aim of the game. The Fibonacci targets are highlighted in purple with invalidation in red. Fibonacci goals, it is prudent to suggest, are nothing more than mere fractally evident and therefore statistically likely levels that the market will go to. Having said that, the market will always do what it wants and always has a mind of its own. Therefore, none of this is financial advice, so do your own research and rely only on your own analysis. Trading is a true one man sport. Good luck out there and stay safe

HDon the action we know that now the seasonal trend begins so we are preparing and looking for areas of accumulation
friends I will keep you informed
friends support me and subscribe to me

HD way oversold, went long last week $308.00 was hoping lowerI started a 500 share position last week and planned to add as I believed $300-305 was the bottom. Target is $348. Good company, dividend increase, blow out earnings report!

strategy for HD TUESDAY 03/01/2022 HD: we will only enter to buy above (318.00) in case of a bullish gap, we would have a gap retest.
HD: we will only enter to sell below (310.00) in case of a bearish gap, we would have a bearish gap and go
strategy: if we see the opening below yesterday's closing price, it would be entering the buy zone, for this reason we should expect the stock to be below the sell price. This is because the previous day's movement was bearish.

$HD, trading it 2/23over 323.5 327-330 possible
under 312 305-308 possible
#intradayoptionstrading #daytrading
NO bias, plan for red or green day. chop/ranging = hand sitting

Home Depots USA Sun Storm Investment Trading Desk & NexGen Wealth Management Service Present's: SSITD & NexGen Portfolio of the Week Series
Focus: Worldwide
By Sun Storm Investment Research & NexGen Wealth Management Service
A Profit & Solutions Strategy & Research
Trading | Investment | Stocks | ETF | Mutual Funds | Crypto | Bonds | Options | Dividend | Futures |
USA | Canada | UK | Germany | France | Italy | Rest of Europe | Mexico | India
Disclaimer: Sun Storm Investment and NexGen are not registered financial advisors, so please do your own research before trading & investing anything. This is information is for only research purposes not for actual trading & investing decision.
#debadipb #profitsolutions

Earnings watch 2/22 pre-marketEarnings watch 2/22 pre-market:
HD
M
MDT
DNUT
CBRL
LPX
TRU
SOHU
TPX
CEQP
Being that the entire global futures are red currently, maybe there's a diamond in the rough for earnings or even an opportunity within the chaos. I definitely feel bad for companies that are releasing earnings this upcoming market week. lol.
Do your own due diligence, your risk is 100% your responsibility. This is for educational and entertainment purposes only. You win some or you learn some. Consider being charitable with some of your profit to help humankind. Good luck and happy trading friends...
*3x lucky 7s of trading*
7pt Trading compass:
Price action, entry/exit
Volume average/direction
Trend, patterns, momentum
Newsworthy current events
Revenue
Earnings
Balance sheet
7 Common mistakes:
+5% portfolio trades, capital risk management
Beware of analyst's motives
Emotions & Opinions
FOMO : bad timing, the market is ruthless, be shrewd
Lack of planning & discipline
Forgetting restraint
Obdurate repetitive errors, no adaptation
7 Important tools:
Trading View app!, Brokerage UI
Accurate indicators & settings
Wide screen monitor/s
Trading log (pencil & graph paper)
Big, organized desk
Reading books, playing chess
Sorted watch-list
Checkout my indicators:
Fibonacci VIP - volume
Fibonacci MA7 - price
pi RSI - trend momentum
TTC - trend channel
AlertiT - notification
tickerTracker - MFI Oscillator
www.tradingview.com

HD trade Opportunity Hd is right near support on the daily chart. Iv isn't that high but earnings are coming up next week which is a bad thing for contracts a couple weeks out. I also see a double bottom forming here at support or a premature w pattern which could bring us back to 420. the rist to reward to about 9-1 and there is a very tight sl

HD trading rangeboundAn upside breakout and a downside breakout both offer opportunities for a HD trader.
Looking for a settlement in either direction for some follow through to the respective targets.

Home Depot Holds SupportHome Depot jumped above $400 for the first time ever in late 2021. Now after a sharp pullback, value hunters may get interested.
The first pattern on today’s chart is the level around $345. It was a peak in May, and last month it was the low. Is old resistance new support? The 200-day simple moving average (SMA) also rose from below.
Next, consider the large, high-volume bullish outside day that occurred as HD held the price zone. That also suggests big investors stepped in.
Turning to the weekly chart, HD is currently trying to form a bullish inside week. That could also suggest prices are stabilizing following January’s slide.
Finally, a strong housing market has supported fundamentals. Earnings, revenue and same-store sales beat estimates on November 16. (Notice the bullish gap.) It’s now given back that entire gain, with the next set of numbers due on February 22.
TradeStation is a pioneer in the trading industry, providing access to stocks, options, futures and cryptocurrencies. See our Overview for more.
Important Information
TradingView is not affiliated with TradeStation Securities Inc. or its affiliates. TradeStation Securities, Inc., TradeStation Crypto, Inc., and TradeStation Technologies, Inc. are each wholly owned subsidiaries of TradeStation Group, Inc., all operating, and providing products and services, under the TradeStation brand and trademark. When applying for, or purchasing, accounts, subscriptions, products and services, it is important that you know which company you will be dealing with. Please click here for further important information explaining what this means.
This content is for informational and educational purposes only. This is not a recommendation regarding any investment or investment strategy. Any opinions expressed herein are those of the author and do not represent the views or opinions of TradeStation or any of its affiliates.
Investing involves risks. Past performance, whether actual or indicated by historical tests of strategies, is no guarantee of future performance or success. There is a possibility that you may sustain a loss equal to or greater than your entire investment regardless of which asset class you trade (equities, options, futures, or digital assets); therefore, you should not invest or risk money that you cannot afford to lose. Before trading any asset class, first read the relevant risk disclosure statements on the Important Documents page, found here: www.tradestation.com .

HD - Breaking down
Bearflag breakdown below VWMA on daily, but just above on 3D chart.
Downside target below 363 -> 344, 326 and 298

Great Company, terrible technicals After forming the double top at around ATHs, HD has found itself falling from grace. Skipping the volume shelf on the way down. Now it is moving towards the volume shelf that seemingly might act as resistance this time around. Another bear flag with another leg down to be seen. Initial short side target would be around 345

HOME DEPOT LOOK FOR A NEW HIGH VERY SOON The chart posted is a clear wave structure we have ended a abc decline into a 50% pull back we are just starting this advance it should last 4 to 9 weeks with an avg of 7 weeks up new high are confirmed .best of trades WAVETIME

Symmetrical Triangle - UpdateHD catching my eye here after it bounced off the long-term uptrend it has been holding- Currently sitting right on its 200-day EMA, seemingly looking to reclaim and close above the .786 FIB level, MACD cross on the 4-hour, forming a big symmetrical triangle while also starting to break out of a falling wedge on the hourly timeframe. Additionally, HD formed a massive bullish shark harmonic pattern- Personally am bullish and will be looking for a breakout here (Broader Market Conditions Permitting) Just some FIB levels & RSI-based supply and demand zones to keep an eye on in the meantime - Previous charts are attached below
- Bullish Shark Harmonic Pattern
- MACD Golden Cross on the 4-Hour Timeframe (Not Pictured)
- Breaking out of a falling wedge on the hourly timeframe (Not Pictured)
- Sitting on the 200-day EMA as well as the .786 FIB level
- RSI starting to get out of oversold territory with buyer volume picking up
PT1- $360.68
PT2- $361.17
PT3- $362.12
PT4- $354.20
--Previously Charted--

HD is the best buy I can find in this marketIt's a close second with XLF. I still feel great about the financials.
But HD is an obvious buy here. Retesting previous resistance for support, trading at 23x which is better than so many in this market, makes big money, and earnings coming up.
Regardless of if the booming housing market slows down, HD is the best in class and great value in a rising rate market.
I'm going to be looking at some March and April calls.

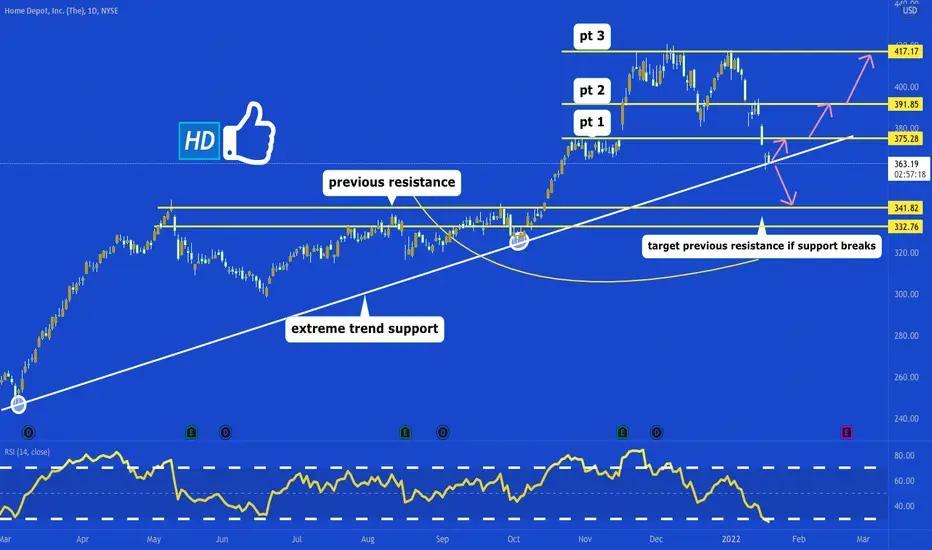
looking for a potential bounce here!🔥hd at a extreme trendline support, make it or break it time!
If we hold these levels and bounce target 375.28-391.85-417.17
If we break the trend support targets are previous resistance, 341.82-332.76
like and follow for more! 💘

$HD ST Long Trade IdeaHome Depot broke down out of a bear flag formation Friday, and now the path of least resistance is DOWN. However, I am speculating on a short term bounce here as HD approaches a good support zone.
Plan is to play weekly calls then look for another short opportunity at $383 zone.

HD - It's only startingHD is looking to move 11.43 for this upcoming week. Double that for two standard deviation moves. I would look for a confirmation from the bottom before it continues it's way down. HD is only getting warmed up. Lots of downside coming. LOTS!
