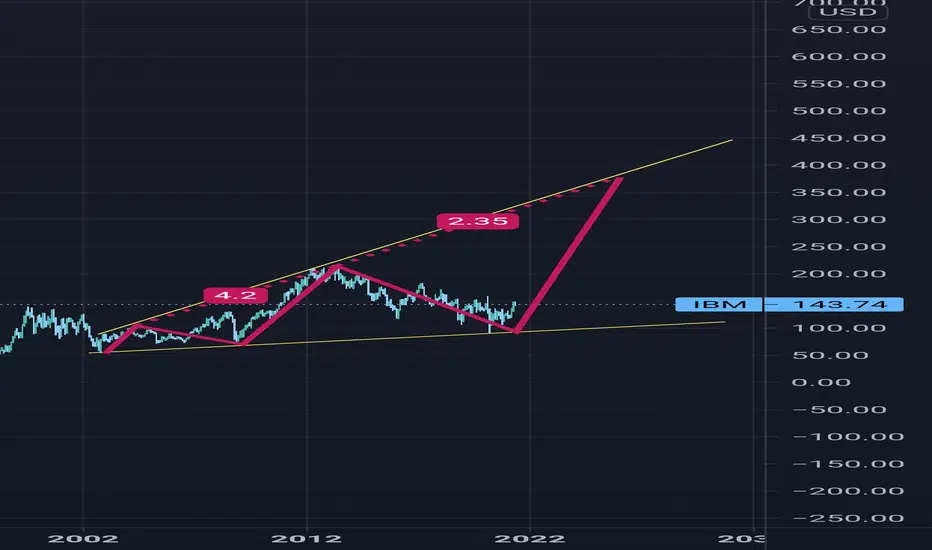
IBM is hot again! Swing trade.IBM weekly chart is currently in a downtrend but bullish cross of moving averages and potential break of the trend line could signify a change of trend and a profitable long trade .
I would wait for for the price to break the trend line (black line on the chart) to enter a long swing trade with a stop loss not too far to protect from a failed break.
Levels and targets on the chart.
Trade safe.
IBM trade ideas

IBM S/R Battle!!Hello Community!
When looking at IBM we can see it clearly trading at the top of the triangle shown on the weekly TF. This has been a powerful rejection area in the past. We have to also take into consideration the more a S/R zone is tested the weaker it gets. The MACD is beginning to tick down and the RSI is showing overbought. I can see a rejection happening from here, which would be a great place to start a short with a tight stop-loss. If entering a trade don't forget to use a stop-loss. Don't trade with what you're not willing to lose.
Love it or hate it, hit that thumbs up and comment. It'll be greatly appreciated!
This is not financial advice.
Safe Trading. Calculate Your Risk/Reward & Collect!
Simplicity Wins (

IBM CloudThis cloud company needs to hire more accountants to handle those enormous cash flows. When Wall Street gets word that IBM returns to growth. The candle sticks this chart is going to make will leave non-hodlers envious.
Technicals: 3 drives pattern.

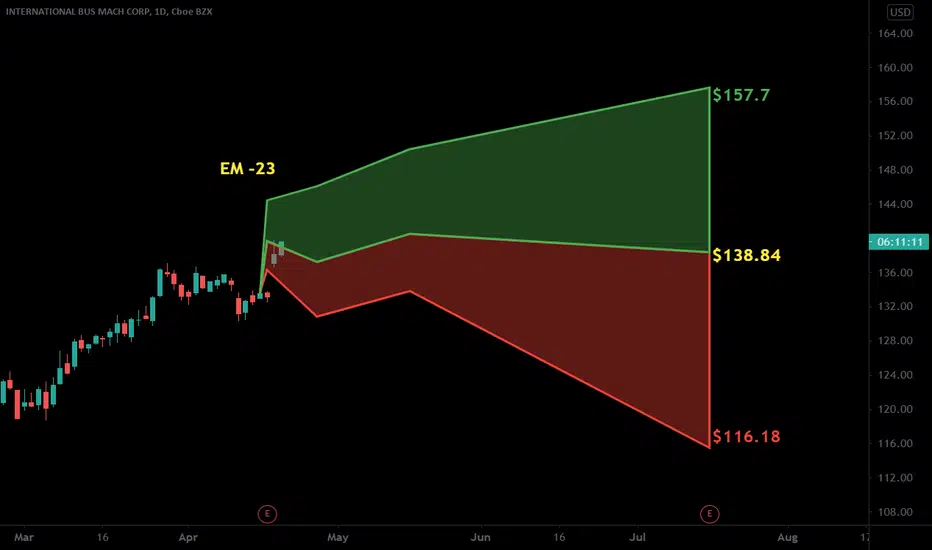
IBM FORECAST - INTERNATIONAL BUS MACHLooks good for shorts above the green line. Stoploss above whiteline. Targets are lines below green. NOT FINANCIAL ADVICE - RECORD KEEPING ONLY.

Hidden IBM reversalI highly suspect that once the IBM has kicked off the spin off IBM GTS to Kyndryl, the SP will confirm the reversal. I feel that Jim Whitehurst has an impact to IBM's future direction by bringing his open source mantra in the executive level, which what made Red Hat very successful.
From a technical perspective, MACD and ADX/DI+ are already showing some very early indications of reversal. So, if the price drops to the support line then I believe its an extremely good buy.

IBM. LONGI have been watching IBM for sometime now. Daily, weekly moving averages support this idea and as we move towards the end of this pennant the monthly open has become support on the verge of breakout within the pennant. 👀 Let's see what happens!

IBM reaching significant resistanceIBM appears to be hitting a wall. This could be a sell the news event now that they announced their new 2 nm chip. Most of the industry is at 7nm. "Buy the rumor, sell the news"

International Business Machines Corporation International Business Machines Corporation is an American multinational technology company headquartered in Armonk, New York, with operations in over 170 countries,
based on the Harmonic Pattern structure that is forming, we will make sure that we monitor Price to reach the Projected target as the Pattern is being filled up to the last major target.


I think you buy IBM and hold it for a decadeIBM dipped after its earnings report Friday and now sits at an important support level. While I'd love for it to dip to $110 or even $100 so I could place a larger buy order there, I have my doubts that it will dip that far. Dips have been hard to come by in this bull market. And while IBM had a disappointing quarter, executives forecasted that it will be back on track to sustainable revenue growth by the end of the year.
For a technology stock, IBM is surprisingly inexpensive. I've currently got the stock's forward P/E at about 10.5, and forward P/S at about 1.4. Compare that to, say, Microsoft with a forward P/E over 30 and a forward P/S over 10. In addition to providing a good earnings yield, I forecast that IBM will yield 5.8% in dividends over the next year. Overall, I estimate that IBM has over 17% upside to its median price-to-value ratio of the last four years.
The reason IBM is so cheap is that its EBITDA per share has been in a long, slow slide for the last ten years. For the last four years, EBITDA has shrunk over 1% per year. Sales growth over the last four years was barely positive, with a growth rate of 0.01%. However, I'm not convinced that these are the most relevant numbers. EBITDA is not a very good measure of profitability, and in fact its current popularity in the investment world is a bit worrisome. A better metric is IBM's free cash flow, which has grown about 0.5% per year over the last four years. And its dividend has grown about 1% per year. So personally I think the company has already turned a corner to the upside in terms of profitability. Plus, IBM has unusually good ESG ratings and generally positive market sentiment, with put/call ratios looking quite bullish and average analyst price target 15% above the current price.
Most importantly, I think IBM has incredible potential as a technology leader. They've had more patents than any other company, by a wide margin, for 27 years running. They're averaging 82 patents per year per billion dollars of market cap, which means you're buying an incredible amount of cutting-edge technology for the price you pay. Of the companies I follow, the next best value in terms of patents-to-market-cap is HPE, with just 26 patents-per-year-per-billion. And IBM's patents are in potentially world-changing fields, like AI and quantum computing. This is by far the best value in the market for a Singularity technology play. And that, more than anything else, is why I think you buy IBM here and hold it for a decade.
IBM has crossed into the lower half of its ten-year triangle and has fairly good risk-reward within the triangle from here. Assuming it eventually breaks out of the triangle to the upside, I'd expect it to eventually recapture its 2012 highs over $200 per share.

Long Term Trendline!We have a downward trendline from the 2013 all time high. It has been a downward spiral since then. We recently hit it again and we might retreat...Note i say might. April's candle was pretty strong,in fact even March's candle was stellar as well. with volume.So this is really a counter momentum (short term) trade i am attempting although long term is in line with descend we have been seeing since 2013. As such my position size will be smaller than usual.
Entry: 141.88
TP: 124.66
SL: 149.07
R: 2.39

IBM , Heavy RejectionAll Details Attached and explained on the chart.
that looks like a bearish move is going to start.
take care of mone managemanet.


Bearish Divergence at PCZ of Bearish GartleyIt may be time for IBM to fill the gap at $133.50 as it has hit the PCZ of a Bearish Gartley and is showing Bearish Divergence on the Stochastic RSI, MACD, and MFI.
Gap fills rarely act as support or resistance so if IBM fills the gap i'd expect it to go a little lower than $133.50 and perhaps drop down to $128 before attempting a rally.

IBMWe are looking for Bullish Movements for IBM Stock and the company has a lot of a chance to perform on a Monthly timeframe. The targeted price for the Company will be around the $190 per share.

IBM 10 year downtrend Break out? I'm skeptical , but if it cracks and holds 142 we fly blue sky.
Had its first positive earnings in years

$IBM with a Bullish outlook following its earnings #Stocks The PEAD projected a Bullish outlook for $IBM after a Positive under reaction following its earnings release placing the stock in drift A
If you would like to see the Drift for another stock please message us. Also click on the Like Button if this was useful and follow us or join us.
IBM - Great Chart- Great newsIBM facts:
Great earnings today ( www.marketwatch.com )
Quantum Computers ( techgenix.com ) and how they will change everything (www.zdnet.com)

$IBM Gartley x 2-618 Looking for weakness on IBM in prz zone, watch for a move higher then fade off type move.

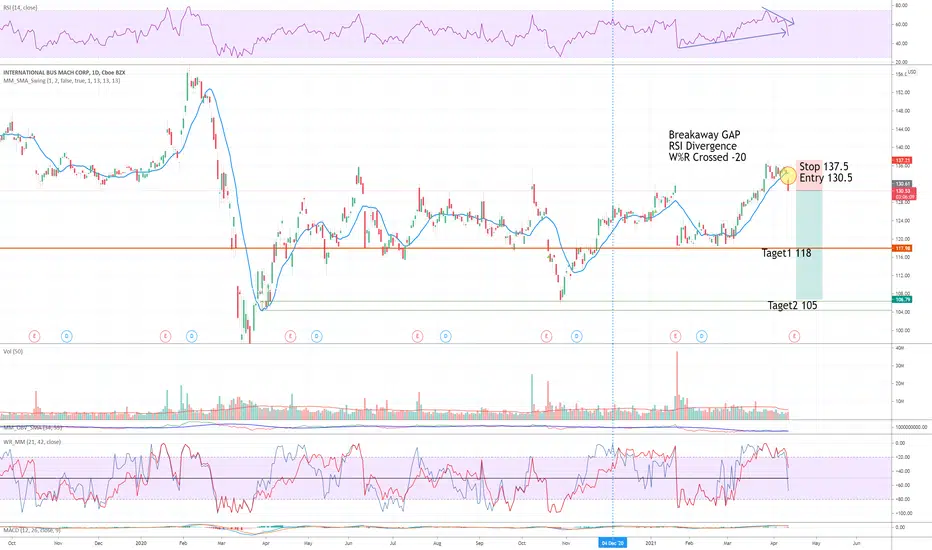
IBM ShortBreakaway GAP
RSI Divergence
W%R Crossed -20
Entry 130.5
Stop 137.5
Target1 118
Target2 105
I am not a PRO trader. I trade option to test my trading plan with small cost.
The max Risk of each plan is less than 1% of my account.
If you like this idea, please use SIM/Demo account to try it.
Inverse Head and Shoulders Rising Wedge?Possible bearish rising wedge. I am not sure but there is also a possible bull flag as well.
I have noticed a bull flag will often take a security through the bearish rising wedge and then recover. If so, this would take price back down to long entry level for the inverse H&S bottom, or possibly lower.
Rising wedges are usually bearish, well almost always bearish. They form due to overactive buying and can be very long term patterns. They are not valid unless lower trendline is broken. A strong stock may not fall far and will seek a level of support within the wedge. A rising wedge has 2 trendlines that converge at the apex.
Not a recommendation.
RSI is not overbought or oversold and a flag like structure is forming there as well.
Leading indicators are a heads-up for economists and investors who hope to anticipate trends. RSI is considered a leading indicator. Leading indicators react to prices quickly, which can be great for short-term traders, but makes them prone to giving out false signals.
Lagging indicators can only be known after the event, but that doesn't make them useless. They can confirm trends and what has been occurring over time. Analysts are a lagging indicator (o:
The MACD is a lagging indicator when trading on the crossovers, it is more of a leading indicator when it is used to highlight possible overbought or oversold conditions.
