IBM trade ideas

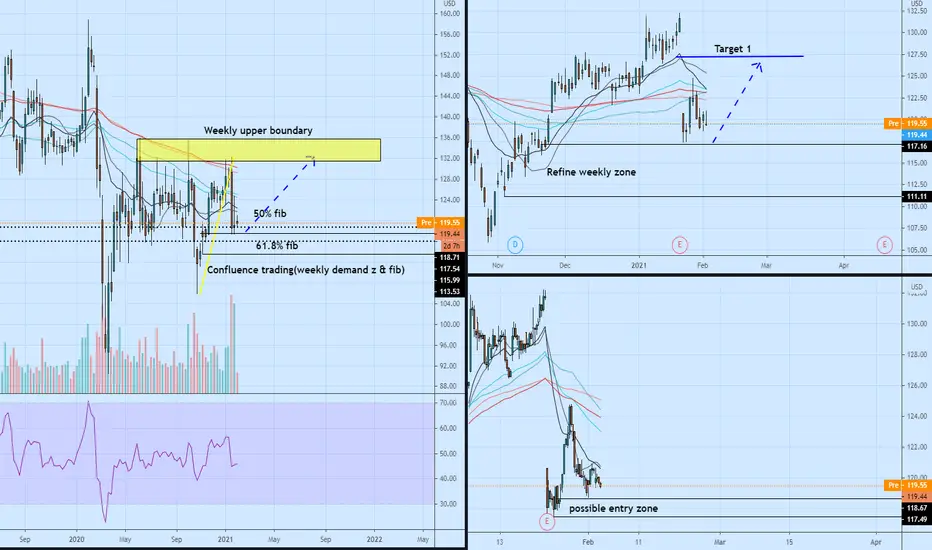
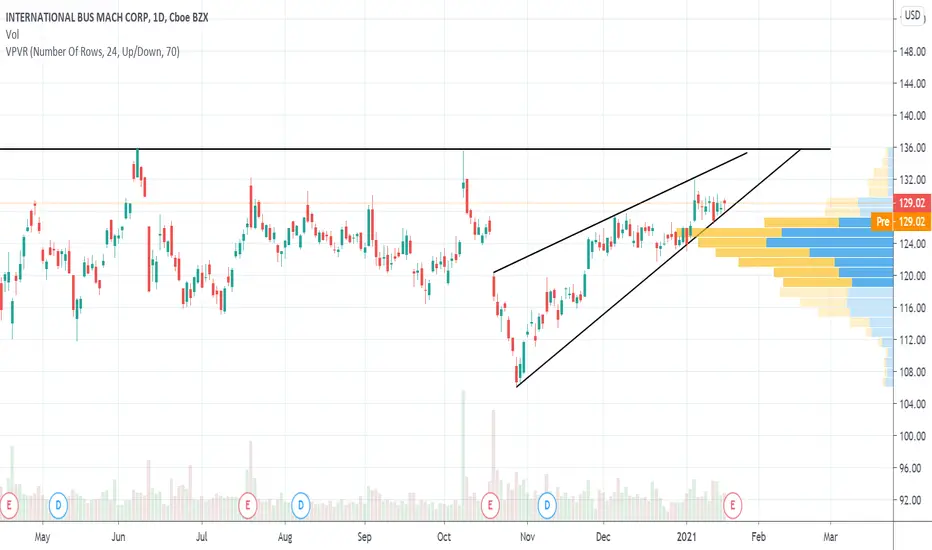
Three bullish setups of IBM on 2H(more confidence in the weekly)My trade idea is based on weekly chart. It's confluence trading with weekly demand zone & Fibs & Flip. If you don't mind the USD4 to USD5 stop loss. You can choose to enter or use call options. I'm confident on the weekly zone.
I drew three possible entry zones on 2H chart for your reference.


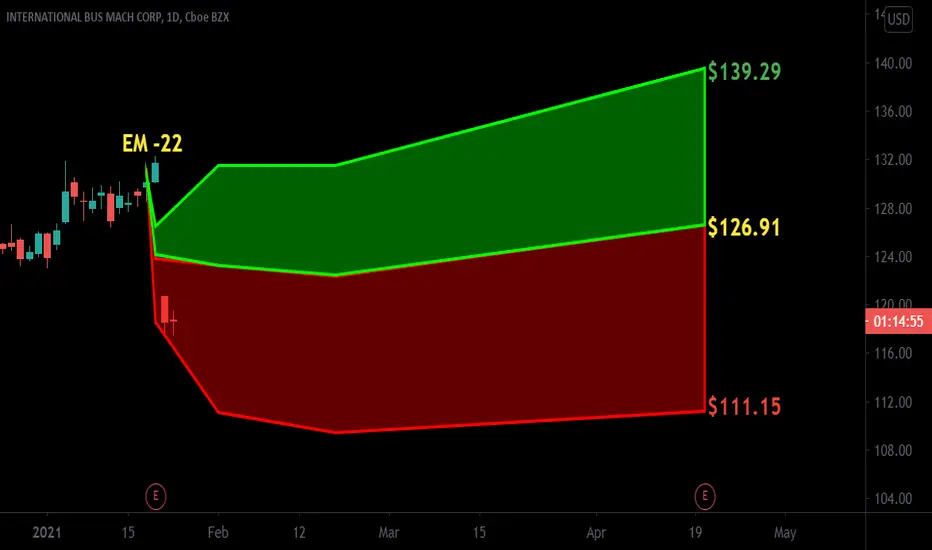
$IBM with a slight bearish outlook following its earning releaseThe PEAD projected a slight bearish outlook for $IBM following a negative under reaction after its earning release placing the stock in Drift D
If you would like to see the Drift for another stock please message us. Also click on the Like Button if this was useful and follow us or join us.


IBM1.23.21 Some "tough love" on IBM do the important work and learn to think like a trader...as opposed to a chartist...there is a difference. There is more than one way to trade...it doesn't have to be what I am doing here, but you can tell the difference between a person who only charts and a trader...in my not so humble opinion. If what I am saying resonates with you and you want to make the transition>>>>> then set up a paper trade account and ask the important question using that account: " do I have a trade here... why...what is my realistic stop and target" IF YOU CHART WITH LINES GOING INTO TWO DIFFERENT DIRECTIONS...THAT COULD BE A CHARTIST WHO IS NOT WILLING TO MAKE A REALTIME DECSION TO TAKE A TRADE AND ACCEPT THE RISK : WHAT BETTER WAY TO CHART THAN TO MAKE A PLAN TO NOT TAKE A TRADE NOW. YOU MAY BE STUCK AS A CHARTIST...BUT THERE IS A PATH TO TRANSITION INTO A TRADER...BUT PAPERTRADE FIRST SO YOU CAN VALIDATE YOUR ABILITY OR FINE TUNE YOUR TRADING. YOU CAN SAVE YEARS OF TIME AND AVOID ALOT OF PROBLEMS IF YOU LISTEN CAREFULLY TO SOME OF THE SUGGESTIONS HERE. ALL YOU HAVE TO LOSE IS A LITTLE BIT OF TIME.


IBM - when to buy this mammoth?IBM has long-standing structural problems, it is trying to change. But so far these changes are not reflected in its financial performance. In general, this is a very interesting company with a large technical base and great potential, but it takes a decent amount of time. Stocks can still sink decently.
The price zone for buying stocks is 75-95.
I believe that this mammoth will thaw out of the ice and move on.
P.S. I wanted to write will rise from the ashes. But the company doesn't look like fenex :D


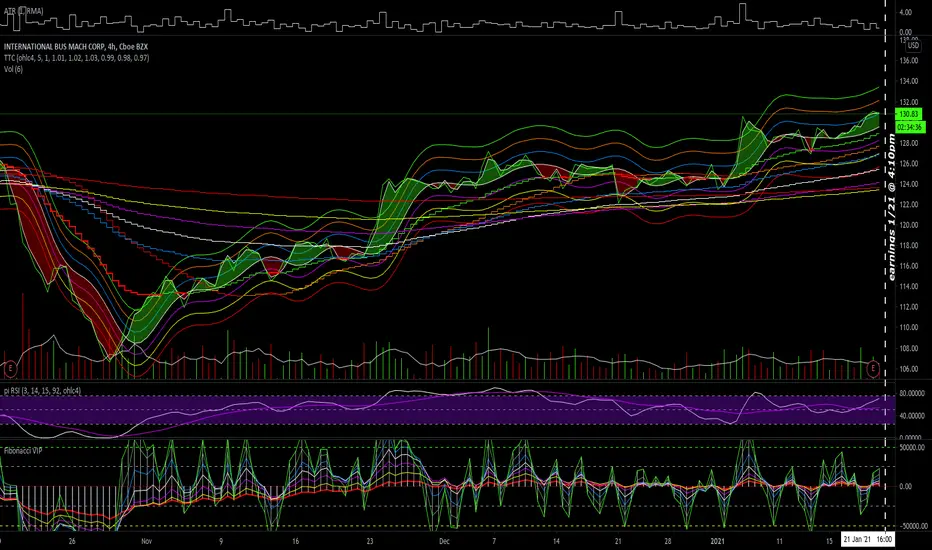
IBM earnings today at 4:10pmIBM earnings 1/21 at 4:10pm
Earnings 4th Quarter December 2020
Consensus:
eps: $1.78
revenue: $20.48 Billion
p/e: 14.6
Do your own due diligence, your risk is 100% your responsibility. You win some or you learn some. Consider being charitable with some of your profit to help humankind. Small incremental steps work : If you double a penny a day for a month it = $5,368,709. Good luck and happy trading friends...
*3x lucky 7s of trading*
7pt Trading compass:
Price action, entry/exit
Volume average/direction
Trend, patterns, momentum
Newsworthy current events
Revenue
Earnings
Balance sheet
7 Common mistakes:
+5% portfolio trades, risk management
Beware of analysts motives
Emotions & Opinions
FOMO : bad timing
Lack of planning & discipline
Forgetting restraint
Obdurate repetitive errors, no adaptation
7 Important tools:
Trading View app!, Brokerage UI
Accurate indicators & settings
Wide screen monitor/s
Trading log (pencil & graph paper)
Big organized desk
Reading books, playing chess
Sorted watch-list
Checkout my indicators:
Fibonacci VIP - volume
Fibonacci MA7 - price
pi RSI - trend momentum
TTC - trend channel
www.tradingview.com


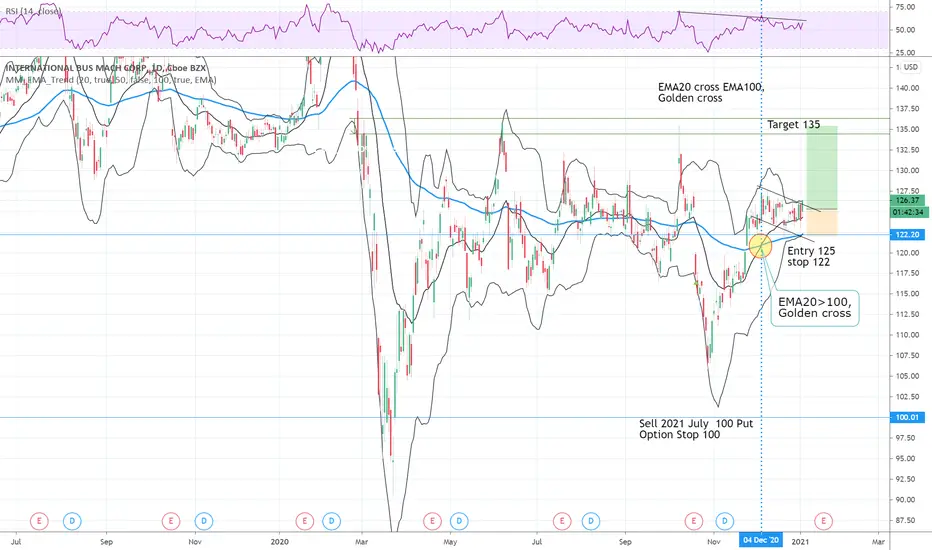
IBM LongEMA20 cross EMA100 as Golden cross in uptrend
In EMA20 upper of Bollinger band
Entry 125
Stop 122
Target 135
I am not a PRO trader. I trade option to test my trading plan with small cost.
The max Risk of each plan is less than 1% of my account.
If you like this idea, please use SIM/Demo account to try it.
Option trade:
Sell Jul Put C60/100 limit 2.5; Delta= -0.15, Theta = -0.02
Option Stop 100;