IBM trade ideas


IBM EarningsSomeone asked me about this a couple of weeks ago...
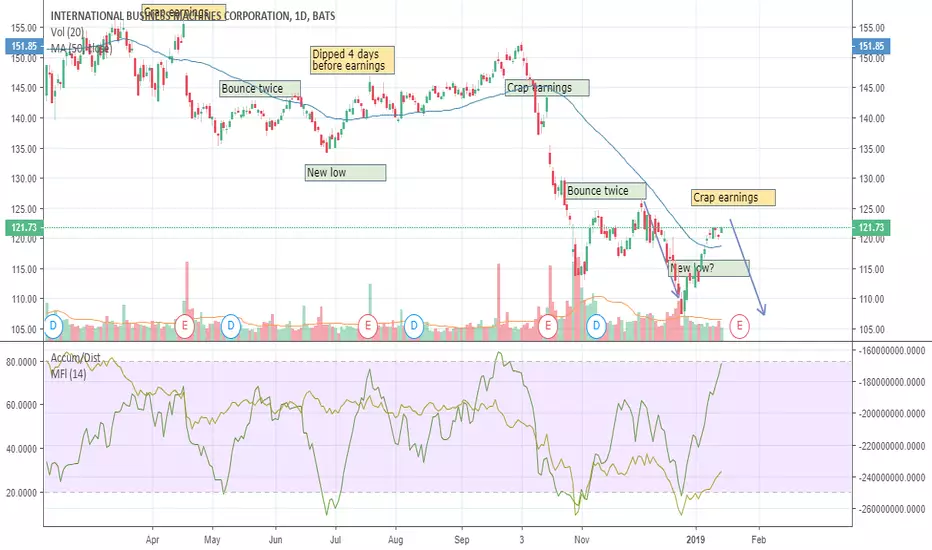
Last time they had crap earnings people started bailing out 4 days before the next earnings. Buying puts at close tomorrow, will roll into a lower strike on Momday if this pans out, if not I'm holding the puts through earnings.
This is strictly a timing call. Also I expect earnings to be crappy. If you're optimistic, buy some calls.
IBM in a bearish rising wedge?Looks like the IBM shows us a bearish rising wedge.
Definitely something to look out for, let's keep an eye on it if it works and if yes how much drop we could expect. For now I expect some pullback to a support at approximately 115$.
Since I'm still learning I'm not trading this.
If you feel the same give me some feedback I'm glad to hear from you guys!
Give a like if you feel I'm right.

IBM Earnings SetupLooks like the computerz are melting the market up again. I expect IBM to work its way back to $125 before earnings. I'm buying puts before earnings.
Has their business improved much in the last 3 months? I doubt it considering the rate increase and stock market tanking. Companies aren't going to increase spending when things are tanking.


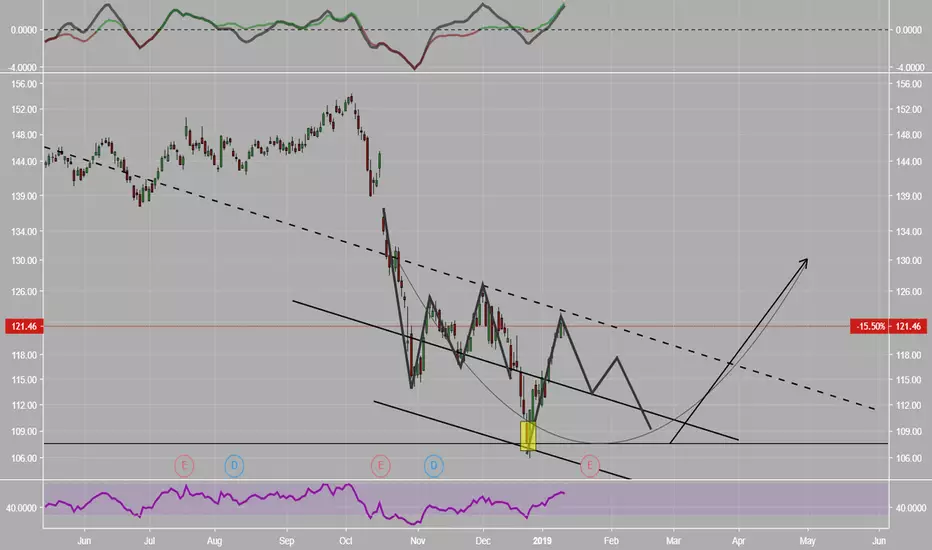
IBM falling out of bear flag channelIBM has been in a classic bear flag channel for a few weeks. It looks like we're breaking downwards now to complete the bear flag pattern.
I'm looking for a drop of about $40 from the top of the channel to somewhere in the $90-100 range. This is consistent with the methodology of the breakout from a flag is about equal to the price move leading to the flag. I think that this is a reasonable area to look for bullish signals after the dust has settled from the Red-Hat merger.

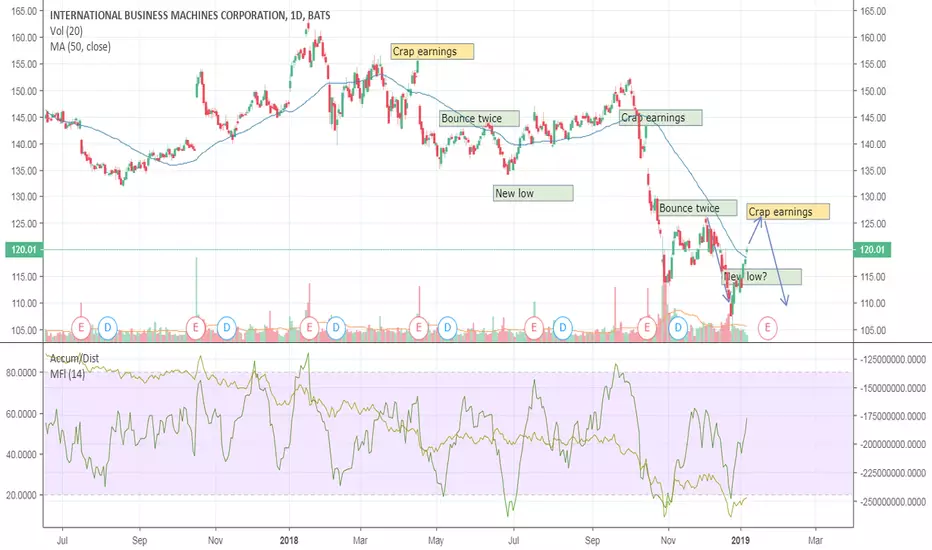
IBM poised for new low?IBM usually bounces up twice before setting a new low. Bought various puts after SPX gap close this morning, decided to keep this one for another week. Target is $112.
If you want to get greedy, $105 marks the double bottom, from Jan 2016, would recommend Jan puts.
Balance sheet already looks like crap, and they're going to overpay for RHT? Not even sure how they're going to come up with $34B in CASH, but way over payment for a company trading at over 60x P/E. If they go through with it, say goodbye to dividends. I bet they nix the deal in January, and the stock goes back up. Of course, they'll get sued though.


IBM Weekly analysisWith a typical sell on news on top on a market selloff IBM broke down the 122-131 OB that contains the biggest consolidation period in price
i've drawn the most probable scenario where price will assess the mentioned OB as resistance.
STRATEGIES RECCOMENDED
1. If price closes weekly above 123 it will create a SFP signaling LONG.
2. If you were SHORT you can move you SL to above 131 and keep an eye to the SFP
I am giving a neutral calification just because in case you want to play it at tomorrow open there is not trade with a decent RR.
