Illuminia.NYSE a Smilly Face Bigger Picture.Illuminia.NYSE has printed a Smiley face pattern as a Rounding Bottom trend.
This simple Trend is Positive sign, and often results in further upside.
I use the Trend Cloud Indicator to show potential entry and exit positions, and while it is a lagging indicator, does offer one a profit scenario in about 90% of my experience.
One needs to see the bigger picture of the Trend to avoid the noise and chose entry and exit positions so that we can maximise the Delta (Difference.)
As allways if you are unshure please consult with your own personal investment Advisor before making any Trades or Investments as most are 12 months or more views.
Should you appreciate my comments and chart studies - please smash that like button. It's just a click away.
Regards Graham
Happy Trade Investing.
ILMN trade ideas

Outbreak with HesitationAlready on May 12th we had left the trading range since 23rd April but then the price has fluctuated around the outbreak level.
After the last backtest of the upper band of the edge it seems that we can go ahead now.
As we could not fall back into the range we seem to get momentum now. A new high would confirm the willingness of the market to try to correct the large fall since mid January.

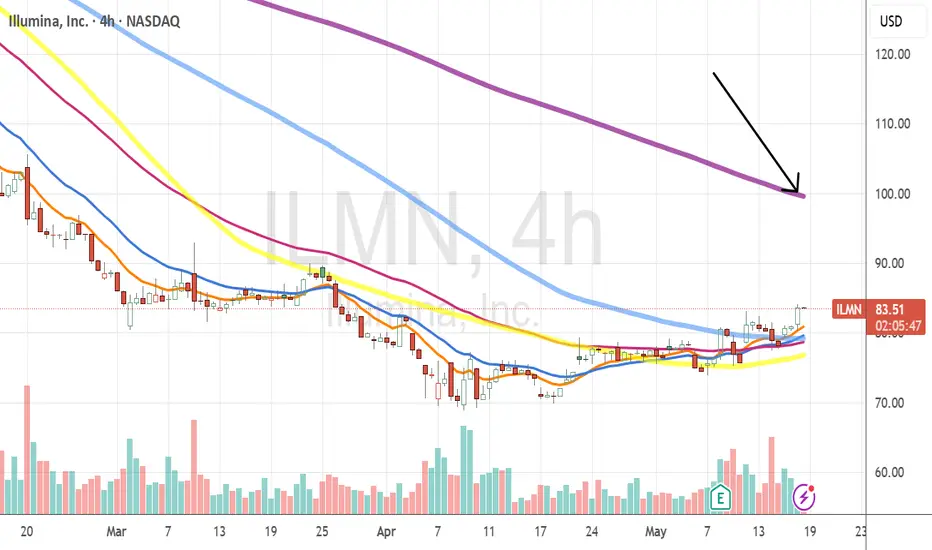
ILMN - Bullish trade This is a 4 hour chart and the arrow is pointing at the 200MA on that 4 hour chart. This is a great breakout that should hit that 200MA in the coming days. You can either buy the shares or for small ccounts you can either sell puts 7 days out just below your entry and collect premium or buy a call and sell at target.
$NASDAQ:ILMN - analysis of annual cot levelsNASDAQ:ILMN
Please remember that this idea does not constitute investment advice.
After a personal analysis of the institutional value of the COT, buy and sell program levels are outlined. Since the asset is at its minimum, the idea is to wait for the price to head inside the buy program, wait for a swing to form in the direction of the target level (the first sell program) and open the trade at the break of this. The position is medium-term (from 1-2 weeks to 1-2 months); without financial leverage and the maximum profit area is that outlined by the sell program. Personally I do not use stop loss as the trade does not involve the use of financial leverage, however if a level for the stop loss were to be identified, this would be below the buy program.
For any clearly ask me.

ILMN Illumina Options Ahead of Earnings Analyzing the options chain and the chart patterns of ILMN Illumina prior to the earnings report this week,
I would consider purchasing the 140usd strike price in the money Calls with
an expiration date of 2024-12-20,
for a premium of approximately $16.65.
If these options prove to be profitable prior to the earnings release, I would sell at least half of them.

ILMNAfter the bullish phase November December 2023, a long bearish phase
which could be concluded with a small final wedge in May June 2024,
so it seems to me that a bullish reversal confirmed above 112 is preparing,
otherwise we could see new lows

ILMN Long PositionHi traders,
Taking a closer look at Illumina, Inc. (ILMN), we can observe the formation of a falling wedge pattern over the past few weeks, indicating a potential bullish reversal.
Illumina, a leading developer of life science tools and integrated systems for large-scale analysis of genetic variation and function, has faced some market challenges recently.
However, the company's strong market position and innovative capabilities suggest significant underlying strength.
The falling wedge pattern is characterized by converging trendlines, where both the highs and the lows are declining, but the highs are falling faster than the lows, forming a wedge shape that slopes downwards. This pattern often indicates a potential reversal from a
downtrend to an uptrend.
As ILMN approaches the apex of the falling wedge, a breakout above the upper trendline could confirm the bullish reversal. Entering a long position upon confirmation of the breakout appears favorable.
1st Take Profit: 195.21
2nd Take Profit: 366.5
Final Target: 523.98

ILMN Bullish ComebackOn the 12 month timeframe, or yearly supercycle, ILMN seems to be consolidating enough these first 3 months into 2024 to ultimately flip to the upside with maximum bull force. The company has a solid catalyst with AI facilitating the end goal of a super biopharma product that perhaps all humanity may have to rely on: a panacea. This panacea may come in the form of a machine that prompts the users exactly what symptoms they have, and produce a medicine that cures said symptoms. Something very well regulated and sophisticated enough to fuel the bull run of the decade for ILMN. A merger should be the cherry on top, and maybe the BNGO merger prophecy comes to fruition, but this only time will tell.

next stock to flyIllumina at 90$ ish to a 5x
The wix is giving green and very low. The rsi is showing oversold and ready to turn upward.
Support shows we could go as low as 79 but anything around this area seems a value buy.

Ending diagonal heralds the beginning of a prolonged bear marketAn ending diagonal starting from March 2020 is seen on the chart for ILLUMINA. This pattern usually signals exhaustion at the end of a bull cycle and the start of a bear market. As seen on the log scale (monthly or weekly), ILLUMINA has been slowly losing momentum for the past decade. Although it may be too early to call this, all long term investors of ILLUMINA must take this into account and should consider the ramifications of holding for the imminent future.

Bullish Alert : ILMNThis long downtrend that never gave a valid signal, is showing again a new Bullish Alert with attempt of crossover.
Price action is still negative on both timeframes, but let's wait for a new signal to confirm our combo.

ILMN Illumina Options Ahead of EarningsAnalyzing the options chain and the chart patterns of ILMN Illumina prior to the earnings report this week,
I would consider purchasing the 195usd strike price Calls with
an expiration date of 2023-9-15,
for a premium of approximately $8.15.
If these options prove to be profitable prior to the earnings release, I would sell at least half of them.
Looking forward to read your opinion about it.

#ILMN is loading profits#ILMN has broken out on the larger time frame and is currently correcting mid way
Look for buy entries and close trades at specified levels

ILMN - Wyckoff AccumulationJust thought I would share that ILMN appears to align with Wyckoff Accumulation patterns as it began to form a complex base from June last year.
The 200 day moving average is now begining to flatten out with the stock making a few attempts to rise above it since this year.
For those with patience, any dips in the coming days will be an opportunity to accumulate. However momentum traders will prefer to see a break above it's horizontal resistence @ 249 to initiate Longs.
You can read more about Wyckoff pattern here.
school.stockcharts.com
Disclaimer: Just my 2 cents and not a trade advice. Kindly do your own due diligence and trade according to your own risk tolerance and don't forget that money management is important! Take care and Good Luck!

$ILMN gapped down provided nice opportunity$ILMN gapped down
Jan 20 190 P were selling for $7.3+ on gap down
Risk reward worth, took stab
#stocks #options
-
Up 50% in a few minutes
But will hold $ILMN Puts, believe it goes higher
Gap @ 204
On the chance we get put, doubt it, but in the chance, it's in a channel 180 - 240
-
Daily in a nice channel

ILMN - inverse H&S breakupILMN has broken up of an inverse H&S neckline last Friday on relatively strong volume.
Let's see if the stock can make a more decisive move to the upside in the coming days.
Otherwise it could continue to be choppy pending earnings release (expected on 3rd November). In any case, it looks like the bottom is in with this base formation
Disclaimer: Just my 2 cents and not a trade advice. Kindly do your own due diligence and trade according to your own risk tolerance and don't forget that money management is important! Take care and Good Luck!

ILMN - Inverse H&S breakup, can it be trusted?An inverse H&S that formed over the last 5 months cummulating in a breakup yesterday.
The marked increase in volume in the past week is encouraing and while the low of 173 on 17July (69% fall form it's peak) is likely to be "the low", it is probaby prudent to only buy small amounts now (in view of overall market volatility) and to add if we we a dip back towards the neckline (but not back below).
We would have more conviction that an uptrend is underway if and when price could at least clear the horizontal resistence @ 259. There is nothing wrong should one prefer to wait till it can clear this level before establishing a trade as sometimes it's better to be later but surer.
Disclaimer: Just my 2 cents and not a trade advice. Kindly do your own due diligence and trade according to your own risk tolerance and don't forget that money management is important! Take care and Good Luck!

ILMN - Inverse Head & Shoulders Looking the huge volume accumulation in the last 3 days, there is a chance that ILMN is going to breakout of an inverse H&S neckline soon. So let's watch!
If it does break up, it should not retrace below the neckline again (if it does, consider this a failed inverse H&S).
Theoretical inverse H&S targe @ 308 (which incidentally is also the 38% fibonacci retracement of it's peak to bottom swing (AB)
Manage positions with trailing stops
Disclaimer: Just my 2 cents and not a trade advice. Kindly do your own due diligence and trade according to your own risk tolerance and don't forget that money management is important! Take care and Good Luck!

ILMN - Not Bottomed YetThis is @HHSPN, 's pick, apparently there's some good news.
Looking at 2W RSI ILMN is already very deep value assuming that the greater trend is to continue. It has only once been below current value back in 2011.
Thats said it looks like its going lower here to the blue band, also considering wicked rejection through resistance.
Its probably a good buy here but perhaps a great buy in that band and/or if RSI equals 2011 and hits 24.
Not advice.

Waiting on $ILMN to recross 50EMA on the daily. Most biotechs are set to rally into 2023 following suppression and release of $XBI through institutional channels. Components inside of $XBI that initially contributed to its rise and gains over the years will be the source to start the process again.

$ILMN with a Bullish outlook following its earnings #Stocks The PEAD projected a Bullish outlook for $ILMN after a Negative Under reaction following its earnings release placing the stock in drift D with an expected accuracy of 60%.

ILMN - Strong Uptrend / Max PainGreen Trend Line is a strong uptrend and has been seen as a position of support in past
I believe the drop could go further below as can be seen on the bottom Horizontal red line, these both are similar situations
Its either this or the Green Trend Line hodls

$ILMN with a Bullish outlook following its earnings #Stocks The PEAD projected a Bullish outlook for $ILMN after a Negative Under reaction following its earnings release placing the stock in drift D with an expected accuracy of 75%.
