JD IH&S looking to be formingMore sweepers came in for weeklies yesterday for 72.5 strike. Still in the sept 77.5 strikes.
Levels posted here 74 then 76 then it can really move. Final target will be low 80s by mid July but some news could send this flying.
JD trade ideas

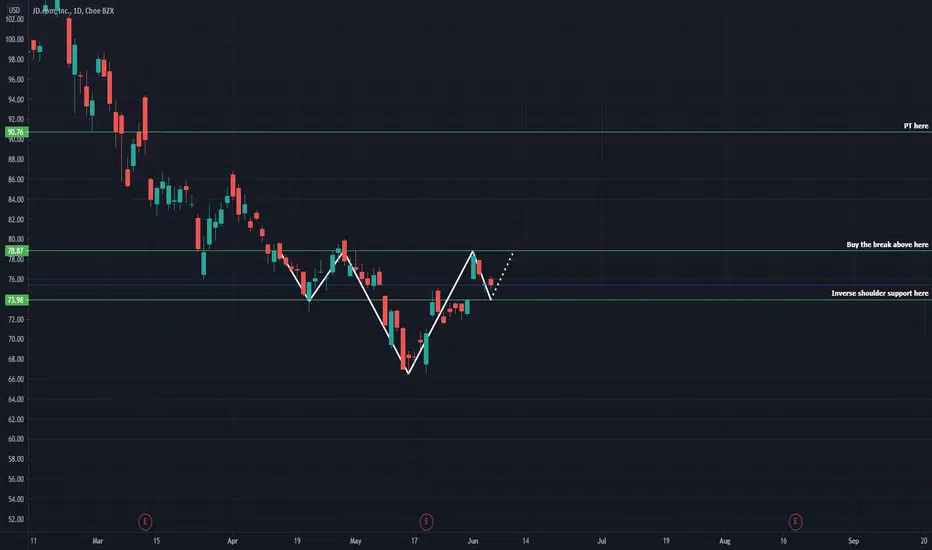
$JD - Inverse head and shoulder formation JD broke out of descending wedge and starting forming Inverse head and shoulder. The right shoulder is not complete yet.
Neck line - $79
Validation point - $80
Good case - $84
Best case - $90
———————————————————
How to read my charts?
- Matching color trend lines shows the pattern. Sometimes a chart can have multiple patterns. Each pattern will have matching color trend lines.
- The yellow horizontal lines shows support and resistance areas.
- Fib lines also shows support and resistance areas.
- The dotted white lines shows price projection for breakout or breakdown target.
Disclaimer: Do your own DD. Not an investment advice.


JD reversal? Possible formation of an inverse head and shoulders. Great fundamentals. Keep an eye on this one along w other Chinese names such as BABA they have been so beat down.

$JD Triple D----Double Doji on Daily After breaking the downtrend last month, JD was able to create a higher low and now doji'd the past two days. Time for it to pick a direction and we strike

$JD | Bullish Channel and Trendline Retest$JD just retested a trendline and price is consolidating within a channel. Watch for a breakout of the channel for a bounce to the upside.
*This is an unconfirmed setup*


JD Bull Hypothesisafter navigating out of this channel it could retest this demand zone then pop to the upside.

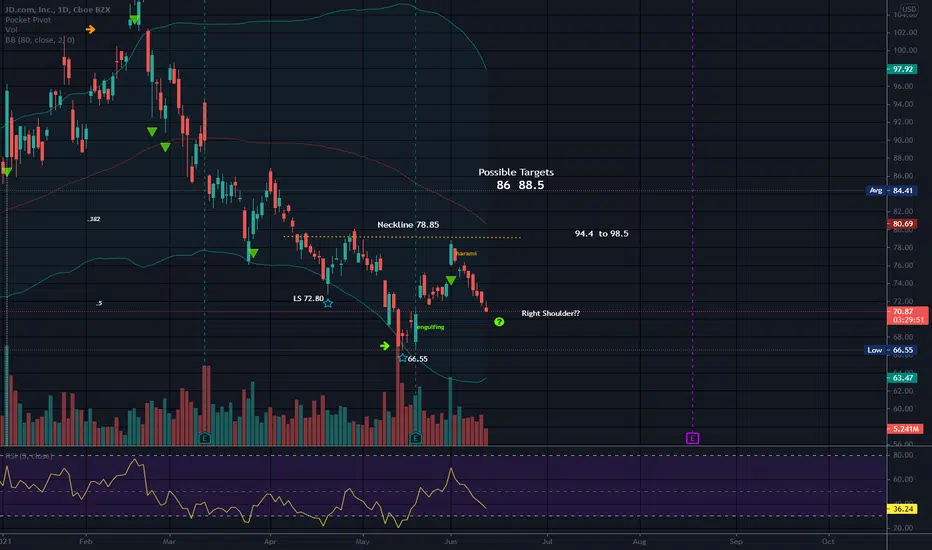
Possible Inverse Head and ShouldersThe right shoulder has not finished forming so I called this a "possible" inverse head and shoulders. If the right shoulder goes below the head (66.55), then it is Not an inverse H&S pattern. The pattern would be invalidated.
Also that may be an inverted hammer today, but we have not closed yet so this can change by day's end. (11:30 am when I posted this)
Long entry level is a break of the neckline with an uptrend. A stop can go under the right shoulder on this one but JD does not exactly have one yet )o: It needs to be a clear bottom, and since today is a lower low than yesterday, I do not see it as a true shoulder yet.
Many would like to see the right shoulder higher than the left shoulder as they feel it is more bullish.
No recommendation
$JD Shop made in china online and retail try the climbMarketmiracle advisor today gave an input signal for a LONG position in the title $JD
The company is basically an online and retail big store widely spread and known throughout China.
Through its online store it is also trying to target abroad by providing the portal in various languages.
I checked on some of my reference sites the situation and position of analysts according to which the company currently has a discounted price compared to the fair price.
Considering this I wanted then deepen the graph in search of a possible confirmation for the signal realizing that the title has suffered a powerful retracement from its recent historical highs and that now, in front of excellent macro data has quickly bent towards the ascent.
According to the combination of the two analyses above I expect a confirmation of the signal of Marketmiracle but you know, in the market the devil can always put his finger on it.
This idea is based on the signal generated by the Marketmiracle advisor whose link you can find by scrolling at the bottom of this page.

JD inverse head and shoulders with call FlowHuge sweepers for September 77.5 calls came through a few days ago those are now down 25% and looks like might be right shoulder bounce today. Risking those calls now against $72 area. Below 72 and I’ll be out


6/1 JD(1) JD has so many gaps above awaiting to be filled
(2) steady support at the blue trend line
(3) break out of the downtrend triangle zone
(4) would be a very good long-term

$JD - Descending wedge breakout - target $87Breaking out from descending wedge.
Target - $87
———————————————————
How to read my charts?
- Matching color trend lines shows the pattern. Sometimes a chart can have multiple patterns. Each pattern will have matching color trend lines.
- The yellow horizontal lines shows support and resistance areas.
- Fib lines also shows support and resistance areas.
- The dotted white lines shows price projection for breakout or breakdown target.
Disclaimer: Do your own DD. Not an investment advice.

(Cont.) Long- 9618 HK/JD USNot sure how exactly it will go going forward in very short term (~2 -3 weeks).
Having said that, I am also more inclined to the movement that it will break through the channel (if I am forced to have a guess on the likelihood, I would put 6.5 on a scale of 0-10.

$JD with a Bearish outlook following its earnings #Stocks The PEAD projected a Bearish outlook for $JD after a Negative over reaction following its earnings release placing the stock in drift C
If you would like to see the Drift for another stock please message us. Also click on the Like Button if this was useful and follow us or join us.

JD falling wedge, long on breakout Holding 80c 1/23, 80c 1/22
Gap was filled, triple bottom
Growth every quarter

JDI spotted an LDC on the 15 MIN. JD is getting ready to pop! I've got me eye on the JD 20th Aug $77.50 Call.

JD.comA strong, profitable company with good balance.
Best price of the year. It will pay off over time.
Time to accumulate. I´m in - green and waiting for bigger discount or biiig premium.
In my opinion, this is not an investment recommendation.
Do your own research.

Long- 9618 HK/JD USKey reasons:
1. Support (channel)
2. RSI:
a) absolute base: Oversold
b) trailing: the bottom of the channel of RSI
3. Hammer in a downtrend
Buy at ~HK$268
First resistance: from ~HK$390 to HK$422

JD | Clearly bearish short termHey all,
on a technical standpoint only, JD.com should be trading sideways or red for the next few weeks.
The 2020 uptrend was broken in early 2021, price is now beneath ALL MAs, and RSI has been stuck in a downwards channel for a while.
The correction may be losing steam as we see from falling volume, but with China relations headwinds on the horizon for a couple months to come, I can see this trading lower over the short term.
I am long the name, so will happily add to my positions in the red zones marked in the chart.
Would love to hear your thoughts!
Good luck to all!
(*This is not financial advice, for sake of discussion and illustrative purposes only*)

JD.com 35% down from peakJD.com is down 35% from its peak. First support at 69 and another support at 65.
