Just want to be there.. $LLYNYSE:LLY is showing classic signs of a Stage 3 top after its massive multi-year run. The trend has stalled, and the stock is now in a volatile sideways range.
Resistance: $975 Critical Support: $690
A weekly close below support would be a major bearish signal, potentially confirming the top and i
Next report date
—
Report period
—
EPS estimate
—
Revenue estimate
—
11.2 EUR
10.23 B EUR
43.51 B EUR
849.66 M
About Eli Lilly and Company
Sector
Industry
CEO
David A. Ricks
Website
Headquarters
Indianapolis
Founded
1876
FIGI
BBG00PKLKBY1
Eli Lilly & Co. engages in the discovery, development, manufacture, and sale of pharmaceutical products. The firm's products consist of diabetes, oncology, immunology, neuroscience, and other products and therapies. The company was founded by Eli Lilly in May 1876 and is headquartered in Indianapolis, IN.
Related stocks
Eli Lilly (LLY) – Full Technical + Fundamental Analysis (July 20
I wanted to take a deeper dive into LLY and analyze more than just trendlines—looking into both the technical structure and the broader fundamentals of the stock.
Sources: i have a list of sources at the end of my report
Technical Breakdown:
Current Price: ~$771.75
Resistance Zone: $950–970 p
Conservative Bullish Case for Eli Lilly: A Pharmaceutical LeaderEli Lilly (LLY) is currently trading at $812.95, having recently shown strength by climbing from the mid-$700s to over $800 in the past month. The stock has established a key support zone in the $760-780 range while testing resistance around the current price level.
Fundamental Strength
LLY's rece

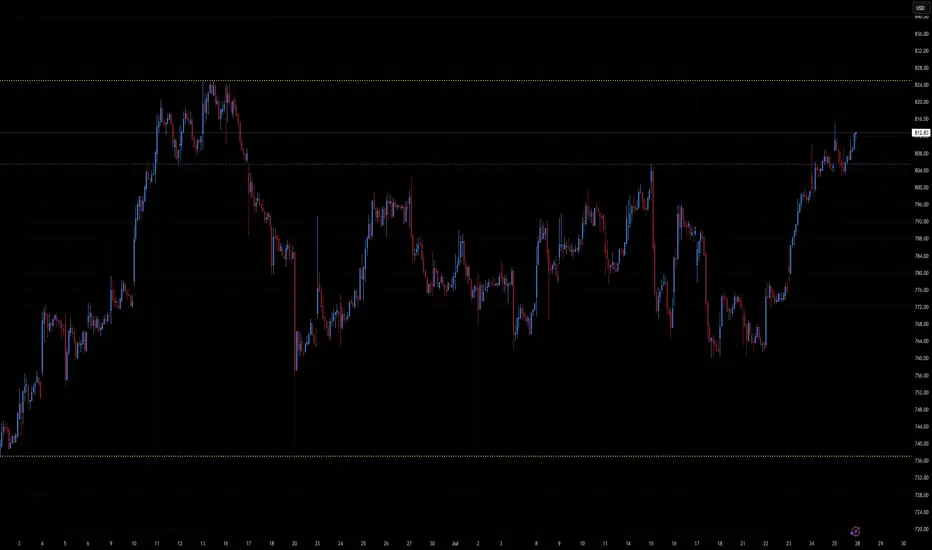
LLY - Earnings upcoming, recent news makes this appealing📈 LLY — Eli Lilly & Co.
Ticker: LLY | Sector: Biotech / Pharmaceuticals
Date: July 26, 2025
Current Price: ~$813
Resistance Zone: $825
Support Zone: $740–$750
🧪 Recent Drug News
1. EMA Backs Alzheimer’s Drug Donanemab (Kisunla)
The European Medicines Agency’s advisory committee has issued a positiv
Long Healthcare and BiotechI think we will go for all time highs soon
TP 1 over 900
Got 2 stop losses on chart depending on time horizon and risk apatite
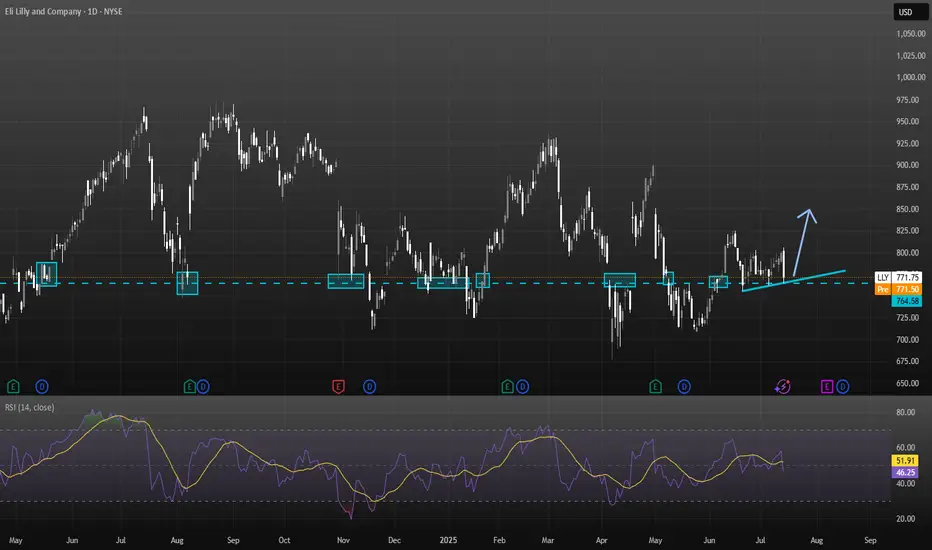
$LLY Technical Setup – Breakout ReloadingNYSE:LLY is holding a critical mid-range level, and the chart hints at a potential accumulation before a breakout. Here's the updated view:
🔹 Horizontal Range Still Intact: Price remains trapped between ~$710 support and ~$965 resistance. These levels have acted as major turning points for over a

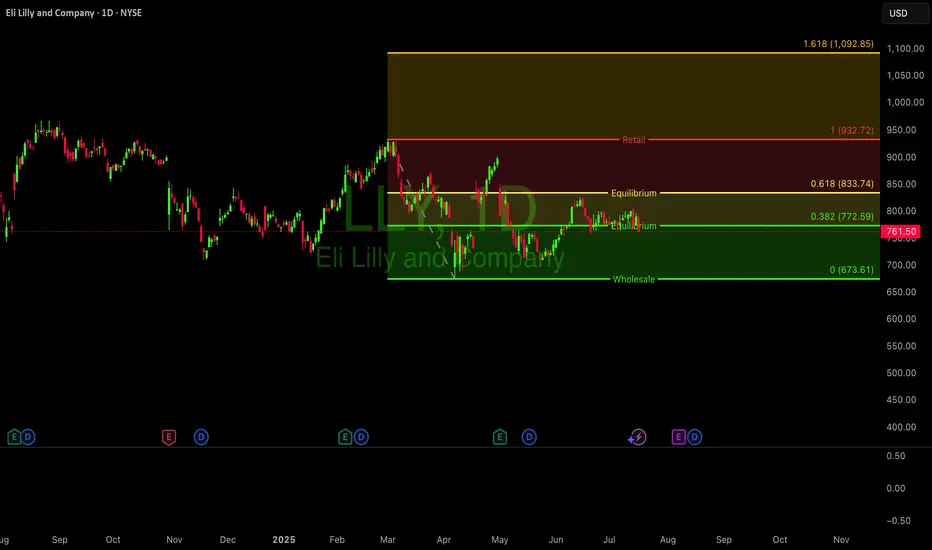
$LLY Low Risk - CookieLow Risk opportunity on NYSE:LLY it is right at the wholesale level... good holding area.. Have a beautiful day!

ELI LILLY Is starting its next big rally.Eli Lilly (LLY) is about to test its 1W MA50 (blue trend-line) following a rebound just below the 1W MA100 (green trend-line). The latter, has been the ultimate market Support since May 2018 (last time it broke below it).
The overall correction since the July 15 2024 High seems like a Bull Flag pat

Eli Lillly $LLYNYSE:LLY – Long Setup Ahead of June FOMC
Eli Lilly remains fundamentally strong, with robust growth in revenue (+45% YoY), driven by weight-loss and diabetes drugs like Mounjaro and Zepbound. Despite this, the stock saw a recent pullback after a lowered FY25 profit outlook.
Technical View:
LLY is

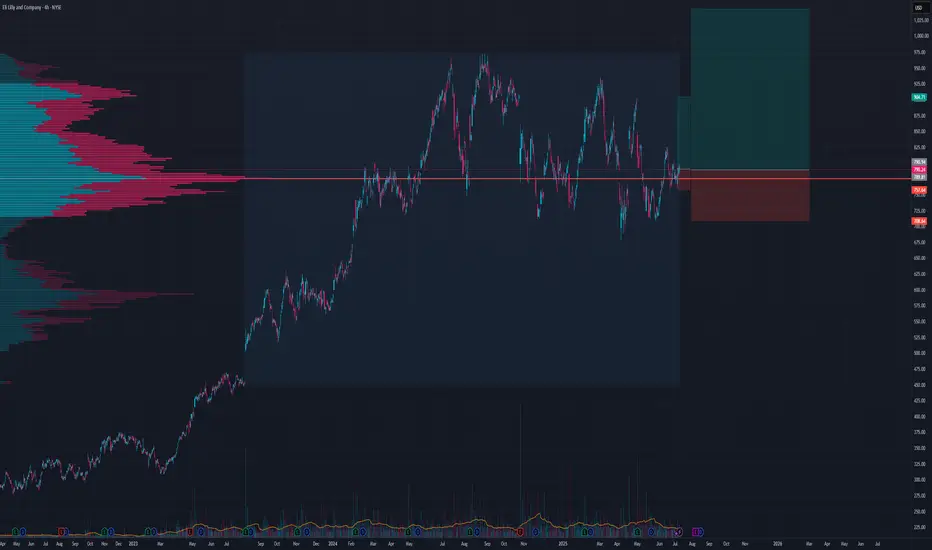
LLY Daily: Navigating Key Levels - Two Strategic OpportunitiesOVERVIEW:
LLY has recently undergone a significant correction from its highs, finding strong demand at a crucial support zone. Price action now presents two distinct, high-probability long entry scenarios based on the stock's interaction with key horizontal levels. My analysis outlines potential ent

See all ideas
Summarizing what the indicators are suggesting.
Neutral
SellBuy
Strong sellStrong buy
Strong sellSellNeutralBuyStrong buy
Neutral
SellBuy
Strong sellStrong buy
Strong sellSellNeutralBuyStrong buy
Neutral
SellBuy
Strong sellStrong buy
Strong sellSellNeutralBuyStrong buy
An aggregate view of professional's ratings.
Neutral
SellBuy
Strong sellStrong buy
Strong sellSellNeutralBuyStrong buy
Neutral
SellBuy
Strong sellStrong buy
Strong sellSellNeutralBuyStrong buy
Neutral
SellBuy
Strong sellStrong buy
Strong sellSellNeutralBuyStrong buy
Displays a symbol's price movements over previous years to identify recurring trends.
XS238628644
ELI LILLY 21/43Yield to maturity
7.80%
Maturity date
Sep 14, 2043
US532457BY3
ELI LILLY 20/50Yield to maturity
7.25%
Maturity date
May 15, 2050
US532457BZ0
ELI LILLY 20/60Yield to maturity
7.12%
Maturity date
Sep 15, 2060
US532457BU1
ELI LILLY 19/59Yield to maturity
6.20%
Maturity date
Mar 15, 2059
US532457BT4
ELI LILLY 19/49Yield to maturity
6.11%
Maturity date
Mar 15, 2049
LLY4492882
Eli Lilly and Company 3.95% 15-MAY-2047Yield to maturity
6.07%
Maturity date
May 15, 2047
LLY4217068
Eli Lilly and Company 3.7% 01-MAR-2045Yield to maturity
6.02%
Maturity date
Mar 1, 2045
US532457BS6
ELI LILLY 19/39Yield to maturity
5.98%
Maturity date
Mar 15, 2039
LLY5547405
Eli Lilly and Company 4.95% 27-FEB-2063Yield to maturity
5.83%
Maturity date
Feb 27, 2063
LLY5750032
Eli Lilly and Company 5.1% 09-FEB-2064Yield to maturity
5.80%
Maturity date
Feb 9, 2064
LLY5547404
Eli Lilly and Company 4.875% 27-FEB-2053Yield to maturity
5.77%
Maturity date
Feb 27, 2053
See all LLYC bonds
Curated watchlists where LLYC is featured.


Frequently Asked Questions
The current price of LLYC is 687.1 EUR — it has increased by 0.67% in the past 24 hours. Watch ELI LILLY CO stock price performance more closely on the chart.
Depending on the exchange, the stock ticker may vary. For instance, on VIE exchange ELI LILLY CO stocks are traded under the ticker LLYC.
LLYC stock has risen by 4.49% compared to the previous week, the month change is a 2.41% rise, over the last year ELI LILLY CO has showed a −12.35% decrease.
We've gathered analysts' opinions on ELI LILLY CO future price: according to them, LLYC price has a max estimate of 1,017.83 EUR and a min estimate of 577.34 EUR. Watch LLYC chart and read a more detailed ELI LILLY CO stock forecast: see what analysts think of ELI LILLY CO and suggest that you do with its stocks.
LLYC reached its all-time high on Feb 27, 2025 with the price of 887.0 EUR, and its all-time low was 94.9 EUR and was reached on Jul 22, 2019. View more price dynamics on LLYC chart.
See other stocks reaching their highest and lowest prices.
See other stocks reaching their highest and lowest prices.
LLYC stock is 1.47% volatile and has beta coefficient of 0.74. Track ELI LILLY CO stock price on the chart and check out the list of the most volatile stocks — is ELI LILLY CO there?
Today ELI LILLY CO has the market capitalization of 655.69 B, it has increased by 0.48% over the last week.
Yes, you can track ELI LILLY CO financials in yearly and quarterly reports right on TradingView.
ELI LILLY CO is going to release the next earnings report on Aug 7, 2025. Keep track of upcoming events with our Earnings Calendar.
LLYC earnings for the last quarter are 3.09 EUR per share, whereas the estimation was 3.01 EUR resulting in a 2.51% surprise. The estimated earnings for the next quarter are 4.75 EUR per share. See more details about ELI LILLY CO earnings.
ELI LILLY CO revenue for the last quarter amounts to 11.77 B EUR, despite the estimated figure of 11.71 B EUR. In the next quarter, revenue is expected to reach 12.47 B EUR.
LLYC net income for the last quarter is 2.55 B EUR, while the quarter before that showed 4.26 B EUR of net income which accounts for −40.12% change. Track more ELI LILLY CO financial stats to get the full picture.
Yes, LLYC dividends are paid quarterly. The last dividend per share was 1.34 EUR. As of today, Dividend Yield (TTM)% is 0.69%. Tracking ELI LILLY CO dividends might help you take more informed decisions.
ELI LILLY CO dividend yield was 0.67% in 2024, and payout ratio reached 44.39%. The year before the numbers were 0.78% and 77.91% correspondingly. See high-dividend stocks and find more opportunities for your portfolio.
As of Jul 27, 2025, the company has 47 K employees. See our rating of the largest employees — is ELI LILLY CO on this list?
EBITDA measures a company's operating performance, its growth signifies an improvement in the efficiency of a company. ELI LILLY CO EBITDA is 19.92 B EUR, and current EBITDA margin is 41.75%. See more stats in ELI LILLY CO financial statements.
Like other stocks, LLYC shares are traded on stock exchanges, e.g. Nasdaq, Nyse, Euronext, and the easiest way to buy them is through an online stock broker. To do this, you need to open an account and follow a broker's procedures, then start trading. You can trade ELI LILLY CO stock right from TradingView charts — choose your broker and connect to your account.
Investing in stocks requires a comprehensive research: you should carefully study all the available data, e.g. company's financials, related news, and its technical analysis. So ELI LILLY CO technincal analysis shows the buy rating today, and its 1 week rating is neutral. Since market conditions are prone to changes, it's worth looking a bit further into the future — according to the 1 month rating ELI LILLY CO stock shows the neutral signal. See more of ELI LILLY CO technicals for a more comprehensive analysis.
If you're still not sure, try looking for inspiration in our curated watchlists.
If you're still not sure, try looking for inspiration in our curated watchlists.