MACY outlookTrend:
Below 50,100 and 200 EMA
ADX, DI below 20
Trend seems to be weak
Macro impact:
Consumer cyclical stock are not a good buy
Inflation impact on consumer purchase
High interest impacting credit buying
Recommendation:
Wait for price to cross above the resistance @ 24.95 for re-assessment
MACY trade ideas

Earnings watch 5/26Earnings watch 5/26:
MOV
BABA
TD
M
DLTR
MRVL
ULTA
DG
COST
JACK
Do your own due diligence, your risk is 100% your responsibility. This is for educational and entertainment purposes only. You win some or you learn some. Consider being charitable with some of your profit to help humankind. Good luck and happy trading friends...
*3x lucky 7s of trading*
7pt Trading compass:
Price action, entry/exit
Volume average/direction
Trend, patterns, momentum
Newsworthy current events
Revenue
Earnings
Balance sheet
7 Common mistakes:
+5% portfolio trades, capital risk management
Beware of analyst's motives
Emotions & Opinions
FOMO : bad timing, the market is ruthless, be shrewd
Lack of planning & discipline
Forgetting restraint
Obdurate repetitive errors, no adaptation
7 Important tools:
Trading View app!, Brokerage UI
Accurate indicators & settings
Wide screen monitor/s
Trading log (pencil & graph paper)
Big, organized desk
Reading books, playing chess
Sorted watch-list
Checkout my indicators:
Fibonacci VIP - volume
Fibonacci MA7 - price
pi RSI - trend momentum
TTC - trend channel
AlertiT - notification
tickerTracker - MFI Oscillator
www.tradingview.com

M Bearish inclined naked calls 13 May expiry (May Track 2)Whats The Plan/Trade/Thought
The Departmental Store sector was not one of my original shortlist. But I also do think my current method of shortlisting from the median of the monthly performance (both negative and positive), might not be the best. Even if the price performance meets my expectations on what I should be trading in a volatile ranging market.
Earning season did not help as part of my strategy is to stay away from earnings which are unpredictable
With nothing to show for my May shortlist. I was exploring my past trades and found that the Departmental Store sector had good prices and WAS close to how I wanted the price movement to be (within a range).
Macy’s had strong S&R lines at 28.54 and 22.97 and had lower high points
I sold calls on this as I expect it to range between the S&R points with a bearish inclination
I Feel
I felt good about this trade, confident as it met my expectations and what I was looking for.
Imagine Yourself Taking The Other Side
With the lower highs I would be worried. Also i expect some bearish movement from the Fed announcements early May
We do know that while the overall consumer sentiment has been bearish, consumer spending is up and rising. This could drive some upside
Imagine Yourself As A Neutral Observer
Given that we feel that it is a Ranging market with Strong S&R lines. I think both could be right but with interest rate increases the probabilities are more bearish
Look For New Information
No new information that I could find on Macy’s
How Do I Feel Now
Post entering the trade, I feel good especially since prices have drop with Fed Powell’s announcement on the half-point hike. I was expecting this price drop to happen in May and not this week as the half-point hike is not a surprise and has been reported before
Trade Specs
Sold 290 Calls @0.26 - Strike 31
% to Strike is 15%
ATR is 1%
BP used 75k
Max Gain: 7540


MACYS Inverse H&S WeeklyAn inverse H&S formation on the Weekly chart on Macys
The price will form a right shoulder and climb out of 1.618
This is bullish for price once completed

Macy's Dim FutureBrick and mortar retail has been punished by online shopping advances.
$M has seen significant erosion since 2015 ATH.
Now seeing rejection on monthly chart by the 100 & 200 EMA, testing 50 EMA in coming months.
Now, in the face of economic slowdown it's increasingly likely that the retail giant will realize further losses given declining consumer sentiment and rapidly increasing prices.
Contracting labor, continued retail shift, inflation... $M will likely revisit $5 price level this year.

So when will Macys crack $30 and beyond?On the weekly chart, Macys hasn't seen much price action. It's pretty much flat and boring. Yeah, there was a pike but it didn't last and that picture stayed the same. It's a real torture having to carry Macys' bags. So let's wait. Wait. Wait and see. Wait till it cracks $28.10 and then we can wake up and prepare to trigger.

Macy USA Sun Storm Investment Trading Desk & NexGen Wealth Management Service Present's: SSITD & NexGen Portfolio of the Week Series
Focus: Worldwide
By Sun Storm Investment Research & NexGen Wealth Management Service
A Profit & Solutions Strategy & Research
Trading | Investment | Stocks | ETF | Mutual Funds | Crypto | Bonds | Options | Dividend | Futures |
USA | Canada | UK | Germany | France | Italy | Rest of Europe | Mexico | India
Disclaimer: Sun Storm Investment and NexGen are not registered financial advisors, so please do your own research before trading & investing anything. This is information is for only research purposes not for actual trading & investing decision.
#debadipb #profitsolutions

$M showing a bear/bull flag Diamond patternM showing consolidation inside the flag, waiting on a move confirmation in either direction.

$MNYSE:M
Consolidating in between key hourly supply and demand zones. Opportunity for play to either side with low liquidity zones above and below. Daily bullish RSI divergence for potential swing on a pull back.
Calls: Bounce of demand or breakout through supply
Puts: Rejection of supply or breakdown of demand

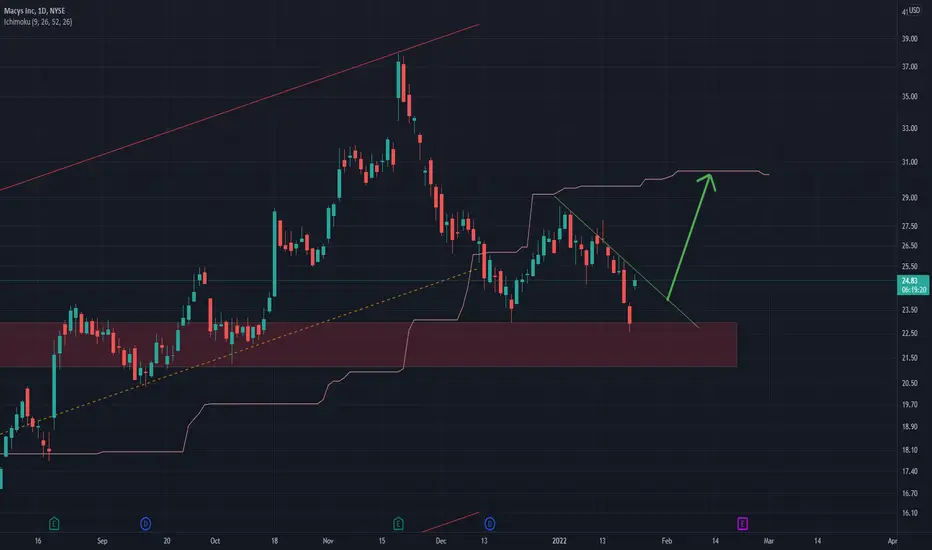
M Long Biased, 25 Feb 2022:
1)ideal entry was 22KL
3)second ideal was second day green low 25KL
4)demand zone: 22$
5)supply zone: somewhere around 30$ (not sure yet of supply zones) but strong res and historic consolidation
Scale out at 28s and Full out at 30s
Always welcoming comments and corrections!
Thank You.
ah and yes we still have time until March 10th )

Macy’s Could Be Holding SupportMacy’s rallied in late 2021. Now it may be holding support after a pullback.
The first pattern on today’s chart is the 200-day simple moving average (SMA). Notice how the department-store operator touched the line this week for the first time since November 2020.
Second, prices have formed a parallel channel this year. The pattern has a slight downward trajectory but roughly ranges between $23 and $28.
Next, the bottom of the channel is near the consolidation zone in October. It’s also slightly above the January 2021 high, which may suggest old resistance has become new support.
Finally, the fundamentals could also be positive because M’s results have beaten estimates for the last seven quarters.
TradeStation is a pioneer in the trading industry, providing access to stocks, options, futures and cryptocurrencies. See our Overview for more.
Important Information
TradingView is not affiliated with TradeStation Securities Inc. or its affiliates. TradeStation Securities, Inc., TradeStation Crypto, Inc., and TradeStation Technologies, Inc. are each wholly owned subsidiaries of TradeStation Group, Inc., all operating, and providing products and services, under the TradeStation brand and trademark. When applying for, or purchasing, accounts, subscriptions, products and services, it is important that you know which company you will be dealing with. Please click here for further important information explaining what this means.
This content is for informational and educational purposes only. This is not a recommendation regarding any investment or investment strategy. Any opinions expressed herein are those of the author and do not represent the views or opinions of TradeStation or any of its affiliates.
Investing involves risks. Past performance, whether actual or indicated by historical tests of strategies, is no guarantee of future performance or success. There is a possibility that you may sustain a loss equal to or greater than your entire investment regardless of which asset class you trade (equities, options, futures, or digital assets); therefore, you should not invest or risk money that you cannot afford to lose. Before trading any asset class, first read the relevant risk disclosure statements on the Important Documents page, found here: www.tradestation.com .

Macy USA Sun Storm Investment Trading Desk & NexGen Wealth Management Service Present's: SSITD & NexGen Portfolio of the Week Series
Focus: Worldwide
By Sun Storm Investment Research & NexGen Wealth Management Service
A Profit & Solutions Strategy & Research
Trading | Investment | Stocks | ETF | Mutual Funds | Crypto | Bonds | Options | Dividend | Futures |
USA | Canada | UK | Germany | France | Italy | Rest of Europe | Mexico | India
Disclaimer: Sun Storm Investment and NexGen are not registered financial advisors, so please do your own research before trading & investing anything. This is information is for only research purposes not for actual trading & investing decision.
#debadipb #profitsolutions

M Decision pointThere is a nice setup forming on M.
Keeping an eye on the next few days to see which direction it decides to break to.

$M - possible breakout soon?Macys has a nice inverse head and shoulders pattern in this consolidation. Would love to see this pop. Saw some $28.5c for 2/25 expiry being loaded so I followed. Let's see how it plays out! GLL!
This is not a recommendation to buy or sell.

Three falling peaks pattern with bearish DivPretty cut and dry explination. Clearly a three falling peaks pattern with bearish div (4hr) on both MacD and RSI. I got in way higher but even at current prices it's not a bad entry to grab some puts, adjust accordingly ofc. Good luck and if you agree or disagree leave a comment, all criticism is good criticism!

MACY'S Weekly Technical AnalysisM - weekly - EDUCATIONAL only - Support, Resistance, Confluence, Pitchfork

MacyYou can buy Macy stocks aiming a mid-term profit!
I prefer to wait until a confirmation.
Beyond the technical: (do your analysis, I’m not educated in the case of fundamental analysis academically)
Fair Price to Intrinsic Value: 0.91 which is a good score!
To summarize my fundamental opinion on this stock:
just good ( a little bullish )
Macy USA Sun Storm Investment Trading Desk & NexGen Wealth Management Service Present's: SSITD & NexGen Portfolio of the Week Series
Focus: Worldwide
By Sun Storm Investment Research & NexGen Wealth Management Service
A Profit & Solutions Strategy & Research
Trading | Investment | Stocks | ETF | Mutual Funds | Crypto | Bonds | Options | Dividend | Futures |
USA | Canada | UK | Germany | France | Italy | Rest of Europe | Mexico | India
Disclaimer: Sun Storm Investment and NexGen are not registered financial advisors, so please do your own research before trading & investing anything. This is information is for only research purposes not for actual trading & investing decision.
#debadipb #profitsolutions

$M ... after retail numbers...Rough retail numbers today... This name getting hit so we will see if the bullish CD wing is still valid or if the follow through of the Doji day yesterday has strength.

M short biaseda lot going on here on this chart. its great to study from because there are so many patterns. At the same time, it makes it harder for traders to decipher which pattern to play. Over all im more short biased. the pull back almost got up to the 38 and it looks to be forming an abcd pattern on the daily with a bearish engulfing. drilling into the 4 hour we also see a head and shoulders which suggests we should go down. as for the bull side there is an inverted head and shoulders on the daily. that being said, inverses don't tend to work as much as normal ones. i wouldn't think about being long biased until the break of the 28.73 and a crack below 25.76 is where id be bearish. levels on chart for reference i would love to see macy's at the 21-21.5 area by earnings for great potential dip buy
NOT FINANCIAL ADVICE

$M Macys Inc $28.30 ⏰⏰
Ley Levels $27.25 & $28.30
Hopefully you find the chart helpful in terms of Supports & Resistance etc.
we refrain from adding commentary on the chart as that is reserved for our members and we are very conscious of not giving financial or trading advice.
Thank you for taking time to consult our chart and we would really appreciate a like, follow or comment.

looks ready to go parabolic in my opinion 🚀Macys bouncing off local support recently and has been in a uptrend every since.
sitting right below a local resistance level, but in my opinion it breaks through and reaches price targets 1-2 in the near future.
This setup reminds me of GME before the big pump happened 🧐
like and follow for more 💘
