Meta correction#meta after break down 309.9$ after bounced many times from this support.
So 309.9$ will be strong resistance now.
At end of the day, #meta can't hold 306$ after rejected 309.9$.
If #meta still hold below 306$ next support will be 299-298$
META trade ideas

Meta big move comingMeta trading within the range of $310-$316. A break above $317 would confirm uptrend. A break below $310 would confirm downside coming possibly to $300 to complete gap fill. CPI news could be the determining factor of this.


#Meta Potential Ending Diagonal PlayIn this update we review the recent price action in Meta and identify the next high probability trading opportunity and price objectives to target
•Past performance not indicative of future results

the correct short target for meta Meta giving very negative tribble divergence in red my short target , if your longing take profit is wise now , good luck everyone.


320 for MetaMeta has be on a tear lately. Do you think the 320 level is possible. Maybe a slight pull back before another run?
Let me know your thoughts

Meta - To Long, Or To Short?I have to say that Meta is one of the hardest charts that exist to read right now, mostly because for 9 straight months, an unprecedented feat in the history of Facebook, it has gone up in a straight line, and bigly.
You only see it clearly on the monthly:
And yet the problem with the bull thesis for a new all time high is the '22 bear raid took out all the sell side all of the way back to 2016.
Although you can have, and speculators and hodlers have been fortunate enough to have had, a significant retrace afterwards, stocks taking long term lows is usually kind of like when a person turns 50 and starts urinating blood.
It means something is wrong with an organ and the time they have left to live is not so long and not so bright.
Even the weekly is insanely one-directional
This stock will have attention tomorrow as post-market earnings have produced another $20 gain, but notably, as of time of writing, have brought the price only to $319, still underneath the July high.
Geopolitical risks abound in the markets right now. Much is happening with Mainland China and the International Rules Based Order. You can consult my previous calls, which are below, for my thoughts on the situation.
But the Cliff's Notes of it is that the 24-year persecution and organ harvesting genocide of Falun Gong by the Jiang Zemin faction and the CCP may soon be made public worldwide if President Xi weaponizes those sins to protect China, its 5,000-year-old culture, and himself from the IRBO intending a Maidan Revolution-style coup to replace him with someone from Taiwan that happens to be a fine lapdog to the global regime's interests.
What is the bull thesis for Meta? Facebook is something of a panopticon data collection system and advertising network rolled into the guise of a social media platform where people voluntarily disclose their location, interests, likes, connections, and spend time interacting with friends and family.
Meta's rebrand is to force the world into something of a Nintendo 64-level version of Second Life, where you're supposed to literally sit in your cube eating the cricket crackers under a bunch of blankets with the furnace/AC off with the VR headset strapped to your face while you do data entry all day.
It's really the kind of dystopian thing the Chinese Communist Party really likes, because it means you can be submissive and agreeable slaves that don't threaten its stability and still produce work.
If mankind's future is truly to return to tradition (it is), what place does Meta have in it?
Meta has very little place in the future, and that's a fundamental problem, really, for everything that revolves around people living chained to computers and phones.
A really notable thing is that the Chinese Government, especially under Xi Jinping since he took power in 2013, has not allowed Meta/Facebook to set up shop inside Mainland China.
The world's most notorious totalitarian regime and the creator of social credit and censorship does not want Meta/Facebook's influence impacting their citizens.
Ain't that something. And yet, you're supposed to be bullish on this... because it's going up.
You just want something to go up so you can buy it and feel pleased when you see green, not sell, and then feel sad when you see red, red, red, and are liquidated.
This is modern humanity.
So here's the question with Meta: is it a short, or is it a long?
The truth is that with Meta, it's gone up in the kind of straight line that makes Apple blush for 9 straight months.
When something trades like this, you can never say "it's a short."
Instead, you can watch for when it does become a short.
And we're in the zone. Although the biggest gap has been filled, the monthly candles show that the bodies of the winning streak's candles are still respecting the range created by the February of 2022 doom candle that ended the Party.
On the daily, the last five days of price action, which correspond with a Nasdaq that may very well have topped but an SPX that does not seem to have topped yet, are the most bearish they have been during the entire bull run.
And so, if you want to get long on open, I can only encourage you to exercise caution. You may really have upside as high as $343. But you may also have upside no higher than $325.
It may also gap up on market open and then sell off, and that kind of a sell off at this kind of a time may mean you are trapped.
To confirm a bull thesis, $343 needs to be broken and maintained
To confirm a bear thesis, the first thing we need to see after the earnings manipulation is for the $288.30 double bottom to be broken.
From there, if $258.88 is broken, the trend is over and will have reversed, even though you may see further upside in the interim.
A break over $325 and then a rejection under $288 would be the most bearish. If that unfolds, it's no longer a dip to buy. Instead, long term puts while the VIX is so suppressed might really be really, really valuable.
And the problem for both bears and bulls is the $40 range that "confirms" whether there's forever uppy or forever doom.

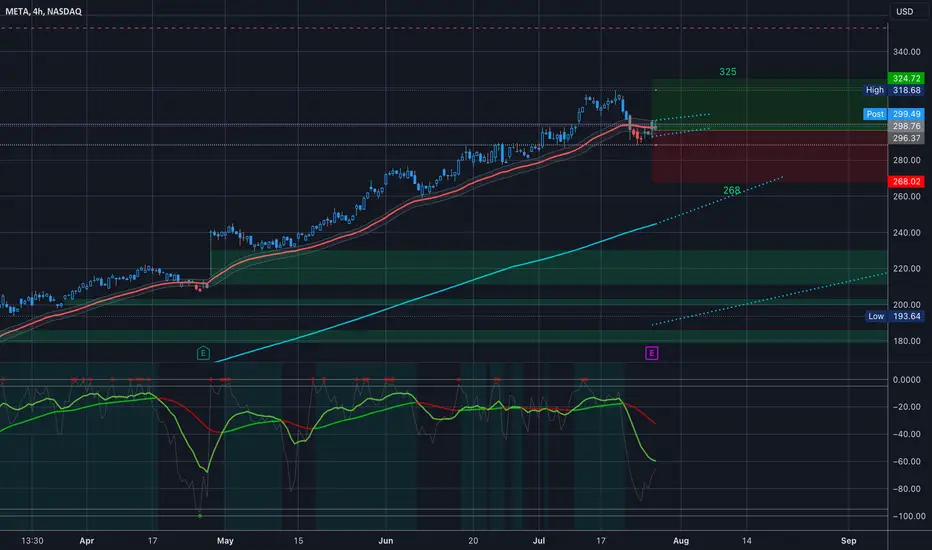
$META - Time for the BEAST to Rest?NASDAQ:META
www.tradingview.com
When I woke up and saw META down 25% in one day, I knew that it was an opportunity that I shouldn't miss out on. I already had a decent amount of Canadian hedged shares and decided to buy more. One year later, I can say that was the best financial decision I made in 2022. Meta is the biggest winner in my portfolio right now, I am going to keep holding a big chunk of this position, but I am looking to take some profits at 353 as I believe that is a level that price action will respect. By respect, I mean either bouncing off it right away or pierce it before the bouncing off.
What do you all think, will Meta take a breather at 353 or will it continue on breaking every resistance it faces?

Channel UPPossible RSI Divergence emerging.
100% of the lower cup takes price to the resistance level of the larger cup.
Funny sometimes how patterns form and exact measurements can be made that match up.
Resistance levels overhead.
I will update if large cup is broken.
No recommendation.
No Rising Wedges noted.

Look for short term buy on METAHello,
META platforms has their earnings release today. Estimates see EPS at 2.54 down from 2.72. Also estimates up to 28.95billion from 27.91billion in the last quarter. I see meta as at a good place to buy 1st target 239.
Good luck friends.

Wow Signal?! 342 343 in sight on #META. July 31st 2023 #longtermWow Signal?! 342 343 in sight on #META. July 31st 2023 #longterm. Nothing but green candles on Long Term Chart. WOW! Play from current level to 342 343 on Bollinger Band.

META is the KEY this week 🗝 Big money seems to have placed a lot of money on the $225 PUT options...META is a powerhouse so play with caution against this upward trend. I personally would only take a small position below $316 to play the Gap fill down to $301.....At $300 area once base is formed load some $355 CALLS long hold positions

META: Potential Early Bearish C Entry on ABCD PatternMETA is showing heavy amounts of MACD Hidden Bearish Divergence and is Extremely Overbought on the PPO after making a 0.786 Fibonacci Retrace of the 2021 Highs and now it is potentially looking to end the BC Wave and begin a CD Wave, which would take it all the way down to the 1.272 Fibonacci Extension located at the $23.56 level.

Long 294Looking bullish with sl 258 and target 294 and if sustain above 294 then 52 week high will break NASDAQ:META

METAHi, Look at this mega trend line from 2013 till 2021 i think price will retrace from this yellow line ......
stay safe and peace

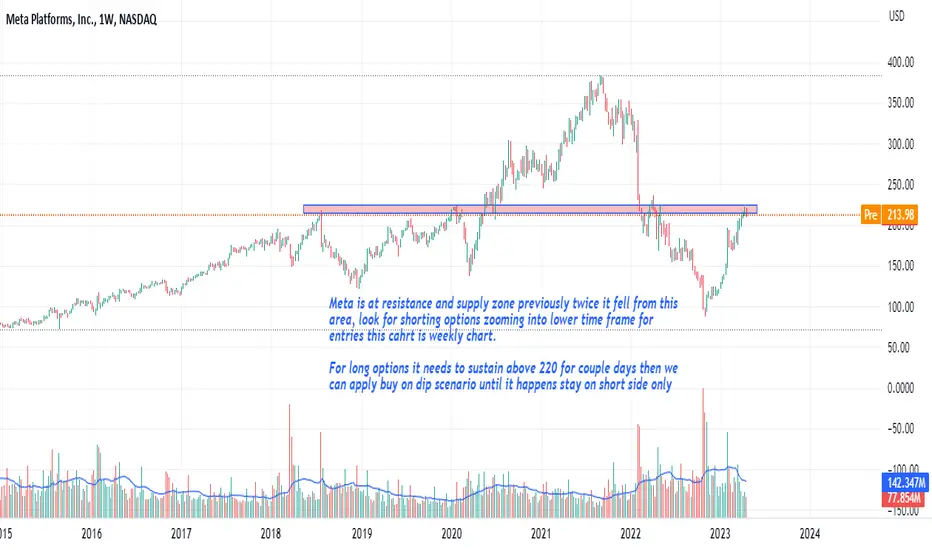
Meta is at resistance and supply zoneNASDAQ:META
Meta is at resistance and supply zone previously twice it fell from this area, look for shorting options zooming into lower time frame for entries this chart is weekly chart.
For long options it needs to sustain above 220 for couple days then we can apply buy on dip scenario until it happens stay on short side only
Meta Earnings are out earnings are great ,but lets not forget -META is investing huge amounts of money in the metaverse and the AR glasses development -huge resources from the company are currently allocated to these 2 developments.
Trade setup:
Gap to be filled up till 310$.
Pending order entry at 310
Stop loss 315 - above candle body after gap is complete (5$ SL)
Take Profit 260 (the yellow gap is our target - not inside the gap on the upper border)=50$ profit
1 lot = 100 stocks // Leverage 1:10
entry 310 X 100 shares = 31,000$ / 10 leverage = 3100$ required margin
Take profit - 50$ X 100 shares = 5000$ profit
Stop loss -5$ X 100 shares = 500$
Risk / Reward = 500 / 5000 = 1/10 (!!!)
ROI = profit / required margin = 5000$ / 3100$ = 1.6 aka 160% return (!!!)
this is a high potential trade with a short SL and a pending order entry which allows us to modify and adjust the trade at real time
This is NOT an investment or financial advice! trading should be done only with money you can afford to lose ! We recommend practicing on a demo for several months before opening trades with real money.

META STOCK UP 7% AFTER REPORTThe social media giant's second-quarter results encouraged investors as ad revenue surged, the company is embracing AI, monetization of Instagram and Reels.
→ Facebook now has 2.06 billion daily active users, up 5% from a year ago. And taking into account Instagram and other applications — 3.07 billion, which is 7% more.
→ At the same time, the number of employees decreased by 14% compared to last year to 71,000 people. Zuckerberg said the austerity program will run until 2024.
Amid the data, META's stock price jumped 7% in premarket trading. The META stock chart shows that:
→ today the price should update the high of the year;
→ with this sharp momentum, the bulls get the opportunity to gain a foothold above the psychological level of $300, pushing off from the support around $290;
Possible resistance level:
→ the $350 psychological mark, where the 2022 high is approximately located.
Possible support levels:
→ median and lower limit of the active ascending channel;
→ the $305 level that had an impact on the price in July.
According to the WSJ, analysts see an average target price for META's stock at around USD 330, but given the company's performance as evidenced by the report, the target price could be revised upwards by analysts.
This article represents the opinion of the Companies operating under the FXOpen brand only. It is not to be construed as an offer, solicitation, or recommendation with respect to products and services provided by the Companies operating under the FXOpen brand, nor is it to be considered financial advice.

$META EARNINGS Analysis, Key Levels & TargetsNASDAQ:META EARNINGS Analysis, Key Levels & Targets
Implied move… OMG, I meant to post this earlier… Oh well… let’s see what happens…
💃🏻
Meta long Ernings hit 52 week High New 52-week highs this week, powered by the Dow which, on Friday, extended its streak of positive days to ten — something the blue chip index has not done in almost six years. The Dow has been powered by, among other things, a slew of corporate financial results, particularly from the banks, which showed not only improved profitability, but also strong guidance for the next quarter and full year.
I have explained 2 bullish scenarios,1 bearish(worse case).
Bullish:
higher highs higher lows
poc uprising
volume increasing
capital flow rising
In case the Take profits hit, and we have increased volume, I will ride the trend.
I will only take profit 10% of the meta portfolio and let the profit run.
Exit :Stop loss or trend change signal

META Entry, Volume, Target, StopEntry: with price above 316.24
Volume: with volume greater than 30M
Target: 333.91 area (this is an area, no guarantee it reaches this price, but you should be selling on the way up)
Stop: Depending on your risk tolerance; Based on an entry of 316.25, 307.40 gets you 2/1 Reward to Risk Ratio.
This LONG swing trade idea is not trade advice and is strictly based on my ideas and technical analysis. No due diligence or fundamental analysis was performed while evaluating this trade idea. Do not take this trade based on my idea, do not follow anyone blindly, do your own analysis and due diligence. I am not a professional trader.

Meta Mega GapThe Meta Mega Gap was made back in January 2022. I started my reaccumalation of this stock around the $100 area. I started to sell off at the $200 area. I will keep a small bag as we start to head into the Mega Gap. I am well aware of the gaps below. There is still one down at the $100 level as well.
I keep my trade ideas simple on the macro time frames. Just need to be patient and follow the trend.
