Could bounce from here and may collapse laterPotential to bounce from here for the next couple of months. After bounce, if it comes back to the current level, then it could be a sign of crash. All the best !!
META trade ideas


META - Melt up & Crash series [3]Blue bull flag (you can't see it unless you zoom in) perfectly broke out and backtested itself creating a new low. Now up from here. All this pent up energy ready to go.
With the room on the RSI I feel it could even reach 2.618 or 3.618 (will have to react assess closer). For now we assume resistance will hold and 1.618 is target before crash.
Not financial advice.

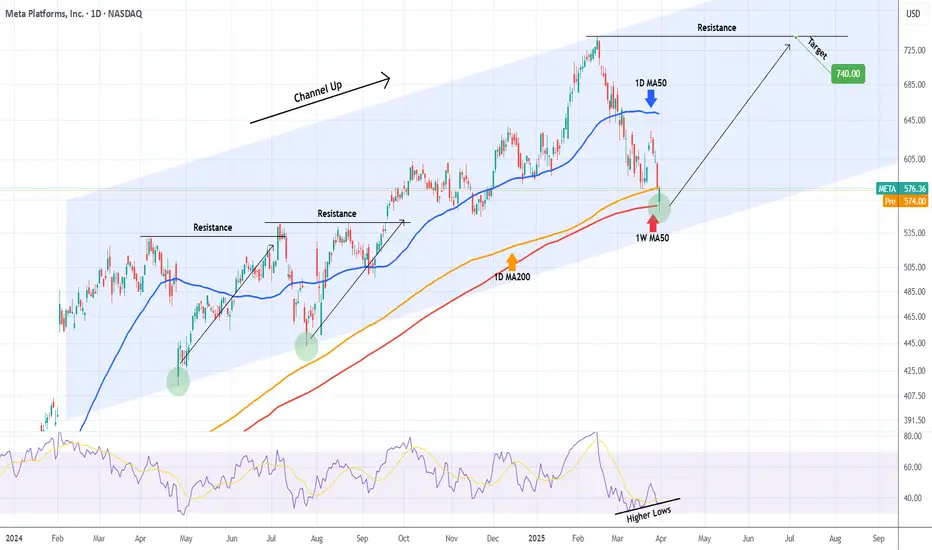
META Can it hold its 1W MA50?Meta Platforms (META) has been trading within a 1-year Channel Up and yesterday it hit its 1W MA50 (red trend-line), breaching the 1D MA200 (orange trend-line) which held the correction last week.
Even though the bottom of the Channel Up is currently $40 lower, holding he 1W MA50 is critical because it has been kept intact since the February 02 2023 bullish break-out.
The first signs are encouraging as the 1D RSI is on Higher Lows, despite the stock's Lower Lows, which is a Bullish Divergence. So as long as this Channel Up bottom Zone holds, we expect META to initiate its new Bullish Leg and test initially its previous Resistance (ATH) as it did on July 05 2024 and August 22 2024. Our Target is $740.
-------------------------------------------------------------------------------
** Please LIKE 👍, FOLLOW ✅, SHARE 🙌 and COMMENT ✍ if you enjoy this idea! Also share your ideas and charts in the comments section below! This is best way to keep it relevant, support us, keep the content here free and allow the idea to reach as many people as possible. **
-------------------------------------------------------------------------------
💸💸💸💸💸💸
👇 👇 👇 👇 👇 👇
META's NEXT BOTTOM FOR THE CORRECTION (SHORT)Meta target reached 746, the level in our previous post.
The correction is currently in progress and by the numbers an aligning bottom within the growth sequence puts the bottom at 485 level. An extended bottom below 485 will see price bottoming at 413 or 385 levels.
Trade safe

BUY FOR ONE MORE UP SWING UNTIL 2026The top is not yet, one more heavy swing up soon
buy more and hold
The panic will end and all the bulls with step forward again soon
Buy...

Global stock sell-off uh oh!This analysis is provided by Eden Bradfeld at BlackBull Research.
The stock market doesn’t really give a damn about what you think. It’s unemotional. DIS or META does not care about your feelings about them, believe it or not. You should be excited that stocks are on sale. If they are on sale even more, you should be even more excited.
You should see it as a form of extreme couponing.
And you know how excited extreme couponers get!
Everyone talks about buying when others are fearful but not many people do it. But extreme couponers, you know, they’re excited every day. Let’s try and be more like extreme couponers.
GOOG 16x earnings, NVO 17x fwd earnings, you know the drill…

Go Long on Meta: Navigating Tech's Resilience - Key Insights: Meta demonstrates
resilience amidst tech sector volatility. With key support levels holding, it
presents a potential opportunity for bullish positions driven by sector recovery
expectations and macroeconomic conditions. Pay attention to regulatory impacts
and earnings reports which could sway investor sentiment.
- Price Targets: For a
long position, aim for T1 at $600 and T2 at $630, maintaining stops at S1 of
$550 and S2 at $540 for risk management. These levels align with market
sentiment and technical analysis, offering a pathway for potential gains. -
Recent Performance: Meta has maintained its structural support despite broader
market challenges affecting the tech sector. While facing downturn pressures
alongside large-cap tech stocks, it shows robust technical setups and the
ability to hold critical support levels.
- Expert Analysis: Experts highlight
Meta's sensitivity to macroeconomic factors and sector-specific challenges.
Attention is on its technical levels, especially around the 200 SMA, ensuring
momentum is preserved. Regulatory developments in the social media space and
ByteDance's strategic moves could influence Meta.
- News Impact: Upcoming
earnings reports and regulatory issues surrounding TikTok may affect Meta's
market dynamics significantly. These events are poised to shift investor focus,
potentially impacting privacy and geopolitical sentiments within the tech
sector. Meta's upcoming earnings have the potential to either affirm or shake up
bullish sentiment further based on financial health and growth prospects.

GOLD SILVER NATGAS OIL BITCOIN TSLA AMZN GOOGL META MSFT AAPL Chart update and analysis on the metals, oil, bitcoin, and mega cap stocks

Looking for a bearish swing on META! H&S!🔉Sound on!🔉
📣Make sure to watch fullscreen!📣
Thank you as always for watching my videos. I hope that you learned something very educational! Please feel free to like, share, and comment on this post. Remember only risk what you are willing to lose. Trading is very risky but it can change your life!

Meta Stock Goes 'Untoward', Fall Off The Cliff 200-Day SMAMeta's Descent into Bearish Territory. Understanding the 2025 Stock Crash
Meta Platforms has recently slipped into bearish territory, with its stock experiencing a significant downturn in early 2025. As of March 31, 2025, Meta shares trade at $576.74, reflecting more than 20.0% decline over the past month and erasing all year-to-date gains. This analysis examines the key factors driving Meta's bearish turn and what it means for investors.
Disappointing Financial Outlook and Investment Costs
Meta's stock decline comes despite previously strong performance, with the company's shares shedding 22% from their February 18, 2025 peak. Although Meta reported robust Q4 2024 profits, its outlook for Q1 2025 has significantly disappointed investors. The company's forward-looking EPS for Q1 2025 is projected at $5.25, raising sustainability concerns despite the previous quarter's EPS of $8.02 beating estimates.
A major contributor to investor anxiety is Meta's massive capital expenditure plans. The company has projected spending $60-$65 billion in 2025 on AI infrastructure alone, raising concerns about cash flow strain if revenue growth falters. These high fixed costs associated with AI investments, including data centers and engineering talent, create particular vulnerability during economic downturns.
Metaverse Losses Continue to Drain Resources
The company's Reality Labs division, responsible for virtual and augmented reality initiatives, continues to be a significant financial drag. This division lost $13.7 billion in 2022 alone with no clear path to profitability. Despite CEO Mark Zuckerberg's continued commitment to the metaverse vision, investor sentiment has soured on these costly experiments as they continue to consume capital without generating meaningful returns.
Broader Market Pressures and Industry Positioning
Meta's decline isn't occurring in isolation. It represents the last of the "Magnificent Seven" tech stocks to turn negative for the year, with the Bloomberg Magnificent 7 Total Return Index down 16% in 2025. The Nasdaq Composite has faced significant correction, declining 7.3% year-to-date and over 12% from its peak.
This market-wide pressure stems from persistent inflation concerns, Federal Reserve interest rate policies, and growing recession fears, creating a particularly challenging environment for growth-oriented technology stocks like Meta.
Influential Market Moves and Analyst Adjustments
Notable market participants have signaled caution regarding Meta's prospects. Cathie Wood's ARK Invest sold over $7 million in Meta stock (12,000 shares) on March 18, 2025—its first Meta sell-off in nearly a year. This high-profile divestment has further fueled bearish sentiment among investors.
Similarly, analysts have begun adjusting their outlook. KeyBanc Capital Markets recently downgraded its price target on Meta from $750 to $710, citing "greater macro uncertainty" and competitive pressures. This downgrade reflects growing concerns about Meta's ability to maintain growth momentum in the current economic climate.
External Challenges Mounting
Meta faces increasing competitive threats from platforms like TikTok and Snapchat, which continue to draw user attention and advertising dollars. Additionally, regulatory headwinds loom large, with an upcoming FTC trial on April 14, 2025, potentially forcing Meta to divest Instagram and WhatsApp—a prospect that has further spooked investors.
In conclusion, Meta stock now stands at a critical juncture, with investors carefully watching whether this represents a temporary correction or the beginning of a more prolonged bearish phase.
--
Best wishes,
Your Beloved @PandorraResearch Team 😎
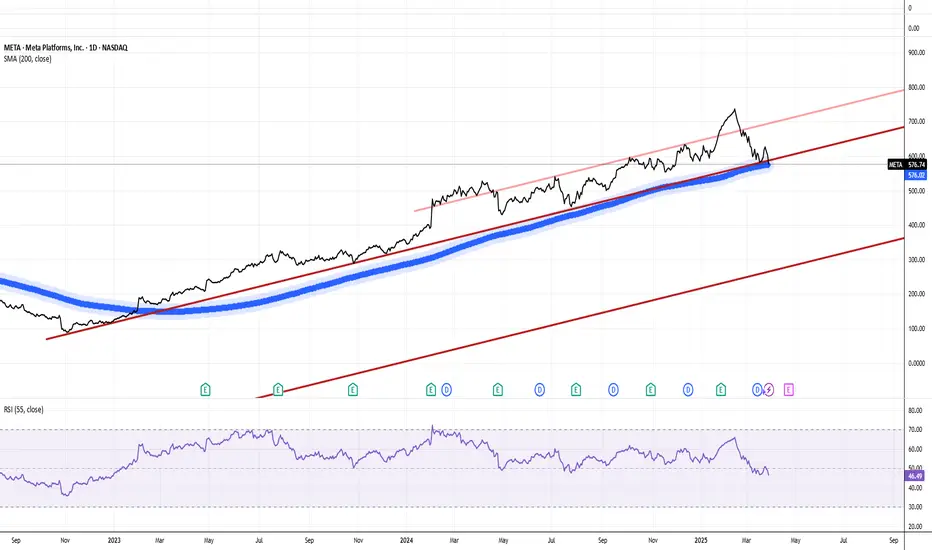
Meta.. Zoom outMeta has really been then engine behind NASDAQ for the past 8 months.. Nvda and MSFT both took a back seat and traded sideways since mid 2024 but Qqq was able gain another 7% from July high until February Top on a few names and meta was a big player.
Going into Q2 and Q3 the technicals are showing me that Meta will most likely take a major Haircut cut this year in comparison with the rest of MAG 7; Call it "catching up".
I always like to take a look at the sector these tech stocks are trading in before I actually chart the stock; Doing that has helped me and giving me more confidence and accuracy with charting the stock under that sector..
So let's look At AMEX:XLC
This sector has 3 main players
1.Meta
2.Googl
3.Nflx
When you start to see a sector about to implode, it usually means the biggest players in that sector will get hit the hardest..
I warned people back in December when XLC monthly MFI hit 90 and the RSI hit 80 that something was about to break. Since then Googl has dropped over 25%. I think this is just the beginning of the correction in XLC and the next big drop will come from Meta and NFLX
XLC
Monthly chart
As I said before The monthly RSI and Money flow is extended and rolling over.
Look at the moves from 2022 low, 136% gain with no pullback 😂. Also notice something Else this will be the first monthly Bearish engulfing since 2022 and 2020; both previous times led to corrections!
Now the thing about monthly Bearish engulfing at the top of an uptrend of this magnitude means likely (65%) chance of a trend reversal. This is a monthly view which means the sell could happen at anytime but I think it will come when either Meta or NFLX reports
My target for April For XLC is 86 minimum, this is 10% drop.. this may not seem like a lot but just look at what the drop from 105 to 95 has caused already..
This is just a minimum target folks. like I said this to me looks like a trend reversal and when that happens you don't really see capitulation until the weekly RSI tags 40.
Now back to meta
Monthly chart
Red flags that stand out to me..
1. Major rising wedge
2. Monthly RSI and MFI hasn't been this bad since July 2018
3. Lastly this stock went 12months 100% extended from it's monthly 50ma
Weekly chart.
My fib levels are from ATH and and IPO low
I think Meta could test 462 by mid may; How we get there ?
I'm look at an immediate rest of 540-550 in the next 2 weeks, if that support holds then we should have a move back up to 600-610 before ER then the real leg down comes
My long term view for meta
50% retracement plus 2021 ATH and also the volume support from Jan 2024 earnings surge
When I said AMD 85 incoming they thought I crazy
When I said TSM 160 incoming when price was at 220 they ask me what I was smoking
I'm telling you this stock tags 460 by end of may
And depending on whether XLC holds 82.00 will determine if meta sees sub 400
So like I said meta 540-550 then bounce but keep in mind the Weekly 50ma.. I expect a bounce there so maybe we don't get 540 price action
I think the first test of the Weekly 50ma at 559 will get bought up with a bounce back to 580-584.

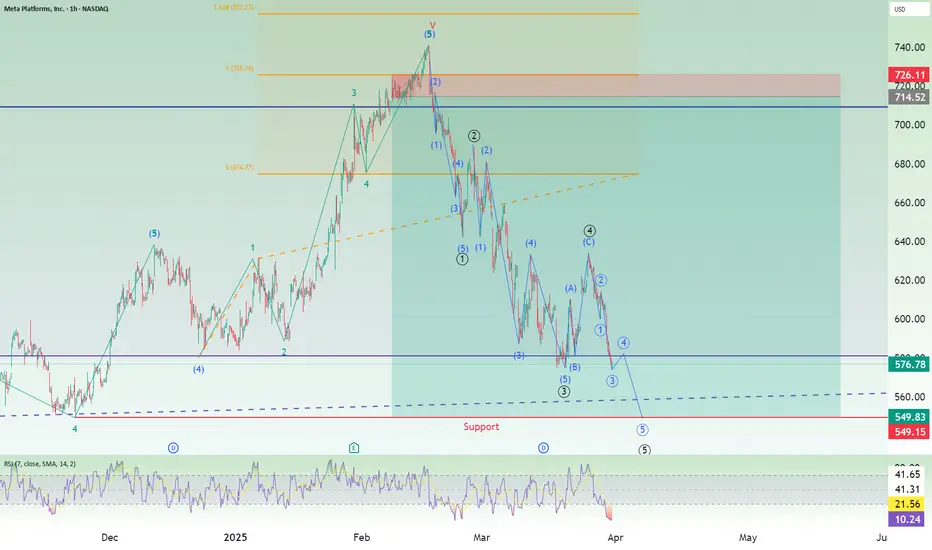
Meta Short: Wave 4 then Wave 5 (Price Taget: $549.50)Update on Meta Elliott Wave counts. While I was right on the last wave up move last time in Feb, I was early by one week for the peak. I left the previous short targets (SL and TP) as a reference and reminder to my mistake in making an early call.
What I expect is that price will range for a short while in wave 4 before coming down as wave 5 on a price target between $549.18 (a historical support price) and $549.83 (old target). The mid point is $549.50 and thus the final price target.
Safe Entry ZoneThe Green 4h Zone Acts as Zone buying Zone.
The Previous High(P. High) Acts as strong Resistance.
Most likely the stock will break through it with Gap up due to sudden news "as usual sudden news" also could act a Take Profit Zone to Secure profit next which act as Strongest Resistance would be the 4h Red Zone act as Major Resistance.
Scenarios Two: the 4h Green Zone Act as the strongest support level.
We have two Scenarios indicating Buyers step in Strongly Within Green Buying Zone:
Scenarios One: strong buying volume reversal Candle.
Scenarios Two: Fake Break-Out of green Buying Zone.
Both indicate Buyers Stepping in strongly.
Once One Showed Up a safe entry would be 50% Fibo from the buying Candle at 1h TF.
Regards,
Take care.

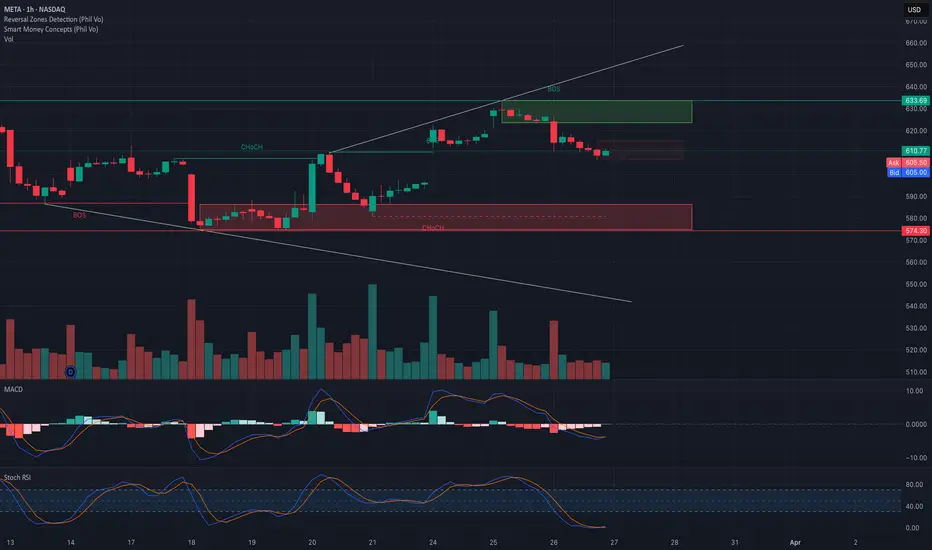
META at a Decision Point! Gamma Pressure Building – Intraday Tra🔍 Technical Analysis (TA) – Intraday Outlook
Current Price Zone: ~$605
* META is sitting just above a key demand zone (595-585).
* It has pulled back from recent highs near 633, failing to hold the upper breakout.
* We saw a Break of Structure (BOS) followed by a lower high, suggesting weakness.
* A bullish CHoCH occurred prior, but it needs to defend current levels to remain valid.
Indicators:
* MACD: Bearish crossover, momentum fading. Needs confirmation for reversal.
* Stoch RSI: Oversold, which may suggest a short-term bounce or relief rally if price respects 595 support.
Key Support Zones:
* 595 → Key support, aligns with GEX Negative Wall (highest negative NetGEX zone).
* 590 → 2nd PUT Wall.
* 585 → 3rd PUT Wall and ultimate line before major structure breaks.
Key Resistance Zones:
* 620 → 2nd CALL Wall.
* 633-640 → Strong call resistance. Rejected earlier here.
* 650 → 3rd CALL Wall, extreme resistance unless there’s a breakout event.
🧠 GEX & Options Flow Analysis (via TanukiTrade )
* GEX Sentiment: 🔵🔵🟢 (Mildly Bullish/Balanced)
* IV Rank (IVR): 33.8 – Slightly elevated, but not extreme.
* IVx Avg: 39.9 – Options pricing reflects a moderate volatility environment.
* Call$%: 11.6% → This shows PUTS are dominating the flow, which often supports the underlying.
* Highest Negative NetGEX: At 595, giving strong put-based dealer support.
* CALL Resistance: 620 → 640 → 650.
* PUT Walls: 595 → 590 → 585.
📌 This 595 area is heavily defended by dealers and acts as a gamma magnet zone, especially for mean reversion trades. It may also act as a base for bounce plays.
🔧 Trade Setups
📈 Bullish Scenario:
If META holds above 595 and breaks back above 610 with volume:
* Entry: Above 610 confirmation.
* Target 1: 620
* Target 2: 633 (previous high)
* Stop-Loss: Below 595
* Options Strategy:
* Buy Apr 12 $620 Calls on confirmation above 610.
* Alternatively, sell $590 Puts if confident in support holding.
📉 Bearish Scenario:
If META loses 595 with high volume and no bounce:
* Entry: On breakdown of 595.
* Target 1: 590
* Target 2: 585
* Target 3: 574 (range lows)
* Stop-Loss: Above 605
* Options Strategy:
* Buy Apr 12 $590 Puts
* Or try a Put Debit Spread (595/585) for limited risk.
🧭 Bias & Final Thoughts:
* Short-term Intraday Bias: NEUTRAL → LEANING BEARISH unless 610 is reclaimed.
* GEX Bias: SUPPORTIVE under 595, but capped above 633.
* Watch for reaction at 595 – it’s the key battleground today.
📛 Disclaimer: This analysis is for educational purposes only and does not constitute financial advice. Always do your own research and trade responsibly.

META at Trendline Support - Will Buyers Push Toward $696?NASDAQ:META is currently undergoing a corrective phase following a sharp rejection at the upper boundary of its ascending channel. The recent pullback has driven the price back toward the lower boundary of the channel, where buyers are now looking to step in.
If buyers manage to defend this support level, we could see a move toward the midline of the channel, with the next key target at $696. A break above this midline would confirm the continuation of the bullish trend, potentially bringing the price back toward the upper boundary.
However, a failure to hold trendline support could weaken the bullish outlook, leading to a potential breakdown and further downside pressure. Price action near this critical zone will be key in determining the next directional move.
Traders should monitor candlestick formations and volume for confirmation. As always, managing risk effectively is essential when trading this setup.
If you have any thoughts on this setup or additional insights, drop them in the comments!

META LEVELS ENDING MARCHMETA LEVELS 3/25/25
Been watching as beginner for a while. I like the level.
Wait for close below $382 before buying again? or good level to check in @ right now for DCA AVerage.

Meta Platforms (META): A Leading Force in AIKey Supporting Arguments
Deploying AI tools enhances user engagement, drives up ad revenue, and strengthens Meta’s profit margins.
Meta's in-house development of AI chips is poised to lower capital outlays associated with purchasing Nvidia chips and diminish the costs involved in developing proprietary AI models.
Meta's stock has approached a support level, suggesting a potential reversal in its price trajectory.
Investment Thesis
Meta Platforms (META) stands as one of the world’s largest technology companies, specializing in social media, digital advertising, and AI development. It owns major platforms like Facebook, Instagram, WhatsApp, and Messenger, which together engage over 3.3 billion users daily. While advertising remains its primary revenue stream, the company is strategically investing in emerging areas such as generative AI and augmented reality.
Continued Commitment to AI Development as a Key Growth Driver. Meta is strategically channeling investments into AI, spearheading the development of open-source Llama models and deploying generative content across its social platforms. These advancements are anticipated to enhance targeting precision and bolster user engagement, subsequently driving a surge in advertising revenue. In 2025, the company intends to allocate up to $65 billion toward AI infrastructure, reinforcing its leadership stature in the competitive AI market.
Focus on Proprietary AI Chips to Lower Capital Costs and Enhance AI Model Development. Meta has initiated trials of its proprietary AI training chip, marking a significant move toward minimizing reliance on suppliers like Nvidia. This new chip is tailored for specific AI tasks, offering enhanced energy efficiency over conventional graphics processing units. By developing its own chips, the company stands to lower expenses and potentially capitalize on the burgeoning demand for AI processing by selling surplus capacity.
Stock May See a Rebound from Current Levels. Following the market correction triggered by concerns over a deteriorating macroeconomic landscape in the United States, the company's share price is stabilizing around the $600 mark. We anticipate that this threshold may establish itself as a significant support level, potentially serving as a springboard for the shares to rebound and continue their upward trajectory. Furthermore, the relatively modest forward P/E ratios, approximately 21-23x, underscore the oversold condition of Meta shares and suggest a possible reversal.
Our price target for META over a 2-month horizon is $685, accompanied by a "Buy" recommendation. We advise setting a stop-loss at $530.

Meta UpdateI don't have much to add to my Meta analysis. I believe that the minor A wave is complete or only needs OML. However, with the sloppy price action that we have had lower, it is impossible to know for sure. Nothing has cause me to question the top I called at this time. Over the course of the next week or two we should know if the A wave is in fact complete. If it is, then we should be targeting the $670-$700 area for minor B completion. For more information check out my past posts on Meta. If anything is unclear let me know.

Meta: Further DownwardWe locate the META in a broader wave IV correction, which should unfold in a three-part - - structure. The current wave should push the price below the key support at $547.57. Once that level is broken, we anticipate a corrective rebound during wave , which should temporarily lift the price back above $547.57. The wave top should be followed by wave , which is expected to complete the overall correction with a final low inside the beige Target Zone between $491.53 and $414.50. This bottom should mark the end of wave IV. However, if the stock instead breaks out to the upside and overcomes the resistance at $740.91, we will have to expect a new high in wave alt.III before wave IV resumes its downward course (30% probability).
