$MRNA with a bearish outlook following its earnings #StocksThe PEAD projected a bearish outlook for $MRNA after a negative under reaction following its earnings release placing the stock in drift D .
MRNA trade ideas


MRNA LONGOVERSOLD and previous support level are at $139-138. Buy and sell when it gets close to 200 MA (blue line) close to the $150-155 range.

Will test 180sIf breaks above 180 it can run to 260s midterm
If gets rejected at 180 will need to come back down and try to form a higher low

modernaI have no exact idea about this stock. it could move in either direction as it is holding - in the middle of both 20EMA&50MA. this is one of the best stocks to add watchlist but not opened a position yet. I will be back to this stock mid-next week after see monthly close on it

Possible Head and ShouldersPrice is above the neckline which is strong support until broken.
ES with the break of the neckline and a downtrend.
Short interest around 4%.
Earnings are estimated to be on 2-23.
A lot could depend on earnings.
No recommendation.
Short with clean break of the neckline.

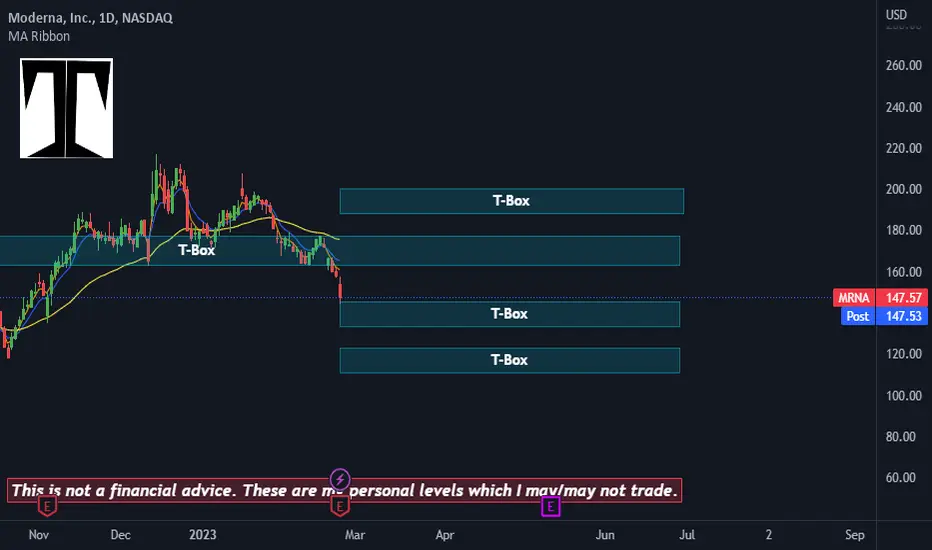
TBox for MRNAConsolidation areas based on Price Action.
EMAs are not usefull at the moment with the price showing negative price action and a bearish setup.
About to dipPrice failed to break the $210 resistance and is going back down. It shouldn't take too long to fall, and maybe in a few weeks from now is going to try to break the $210 again, but not now.

Bearish trade idea on MRNAWe should continue lower to about 151 and some change and have a retest into about 165-170 -- Looking for a bearish play and roll over!

Moderna (MRNA) ... Time for a shot in the Arm ?Moderna (MNRA). This is a potential long trade if it reaches my area of interest in my PRZ (price reversal zone).
A nicely formed ABCD formation together with a Harmonic Crab / Alternate Bat (depending where X starts), come together in the mid to low $160s.
(This also happens to come full circle to the recent December 2022 low.)
This together with positive momentum hopefully sets up one or both of the targets objectives.
I wouldn't chase this and beware of broader markets.
Earnings are expected Feb. 23rd at $4.70.
As always DYODD.
I will monitor
S,

mrnathe stock name is mrna which means to die, and the ema crossover suggests so, when the emas crossover like they have crossed over right now it is known as mini maharaja death crossover, so short

MRNAModerna shows 145 or 115 as a target on the short side..
Building a very good base up here or it's preparing to break below 115 to target 80$.
Nonetheless been short since 210/share.

MRNA Short$MRNA in the ol wedge formation is going to send this thing down to the low 100's at least.
U.S. no longer in a pandemic will send the company earnings to doo doo once more.

$MRNA - Moderna Short Thesis 2-8-2023$MRNA - Moderna breaking down. 50MA sloping down. Wave 3 of 5 Down Waves. See notations in chart. Just a technical thesis. Not investment advice...

Bullish Crossover for MRNA Share Appears in the HorizonModerna's share (MRNA) price has been running in a narrow price range since November 8 after a series of gains extending since October 21, surpassing the short and long-term exponential moving averages in a positive short-term sign. Meanwhile, an unclear zigzag path has dominated MRNA share since the beginning of the year.
As for now, and on the daily chart, we keep an eye on 180.13 and $198.82 as possible bullish targets, as we await the bullish crossover of the MA-25 and MA-50 to achieve the possible bullish path.
On the flip side, if MRNA share price fails to stabilize above the $162 level, the previous bullish hypothesis may be invalidated, and we may witness a pullback towards $142-135 levels (yellow shaded area).


MRNA MOONDERNA INC COMShowed up on Stikstockitslive properietary scanner. Decent entry risk managing leaving room for < 150. Decent short term entry here RSI BLUE LINING.
STIKSTOCKITSLIVE

The HERCULES portfolioIt's time to keep a close eye on HERCULES portfolio stocks to be ready to reposition once the rules I've outlined in my post “A trading system for rookies” are met.
I also urge you to consider positions in the Greek Stock Exchange where there are now many reliable and safe stocks that are in a mature phase of rise.
Some of them are presented below. For more information you can search the recent reports of major investment houses Morgan Stanley, JP Morgan and others.
Also take a look at my post “Is the Greek stock market ready to skyrocket?”.

Never EasyCup & Handle
This broke out and experienced a throwback.
The throwback sent it back down to below long entry level.
Volatile but we trade at our own risk.
It does seem this is a stock one should slip in and out of, collect profit and move on, but who knows?
Throwbacks differ from pull backs. Pull backs are natural and are considered healthy.
Throwbacks can hurt performance and occur when a security has issues holding on to the break out price and throw back to beneath the long entry level in a quick manner.
No recommendation.
This does look like a CUP with a rounded bottom and does not have a pointy W at the bottom of the cup that I can see. Any pattern can fail/price is just below the .618 of the trend up.

MRNA - Short Initiated
April '23 130 Puts.
Been waiting for this trend line to be hit.
Setup the notification a few weeks ago - did not pay attention to it, TV worked perfectly - notified at 3:45PM on Friday, as you would expect.
This company (krime org) which has been funded through the US D_o_D. Yes it's all misspelt.
Which sounds crazy - but hear me out. Watch the video below.
rumble.com
Likely you can get in Monday - this is the top of the regression channel.
One Hour chart.

MRNA (cont.) 4hrNice head and shoulders pattern forming so expect up and down movement these next couple weeks or so. I will say to just play it day by day and the swing longterm puts when the shoulder is complete.

MRNA Daily TA Bullish expanding Triangle on the weekly and daily timeframe. LONGTERM PLAY. Will post a 4hr time frame chart to show levels.

Moderna about to explode?Price has been testing the mayor resistance for a year, and trading for a month just there below it ready to test it out again. I think this time is going to break it. I have a small position and a wide stop loss. If the price breaks through and closes the week above the resistance, ~204 level, I'll add.
