NFLXNetflix's trading pattern has exhibited a notable uptrend and has remained within a channel, indicating potential for a bullish trade opportunity. However, it is important to exercise caution and implement effective risk management strategies, such as a tight stop loss, when dealing with a high-growth stock like Netflix. This approach will help to mitigate potential downside risks and safeguard against adverse market movements.
Red level is resistance
Purple is pivot level
green is the buy zone
NFLX trade ideas

NFLX AnalysisPrice consolidated since my last analysis. There are no signs of change of character on the lower timeframe. Price seems to be creating sell-side liquidity for price to go lower. I'm expecting price to head lower into the bullish POI at 300.66.

BUY BUY BUY After a brutal February Netflix is currently trading at trendline support.
- No significant economic event until March 14 CPI inflation.
- Sitting at trendline support which held the stock for over 3 months.
- Many analysts believe March will be a dip buying opportunity, therefore we could see another rally in Netflix.
The first level to pay attention to is $330.


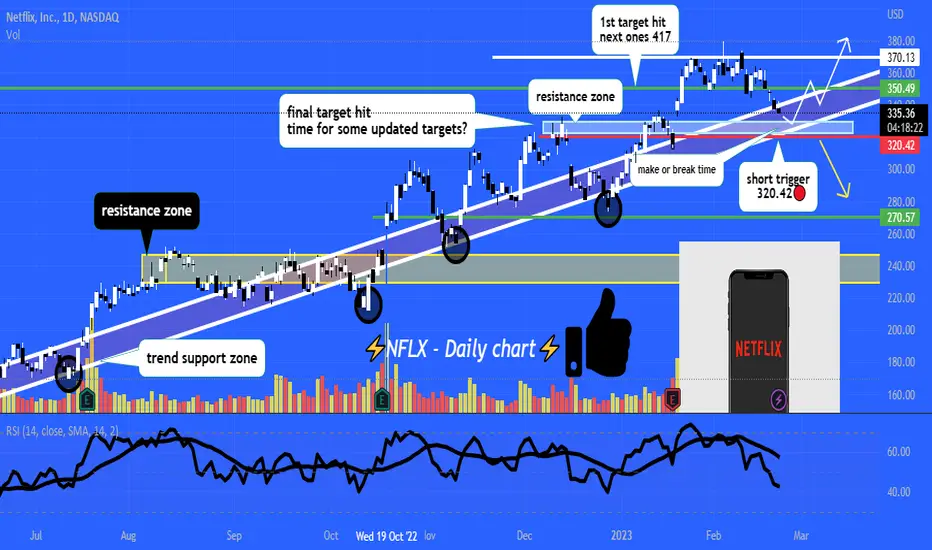
NFLX make or break time🥶I have been mentioning this bullish trend support for months now, break of 320/trend and we see more downside!
but we most likely see another bounce and rally to 370-400 in the next few months
boost and follow for more 💙
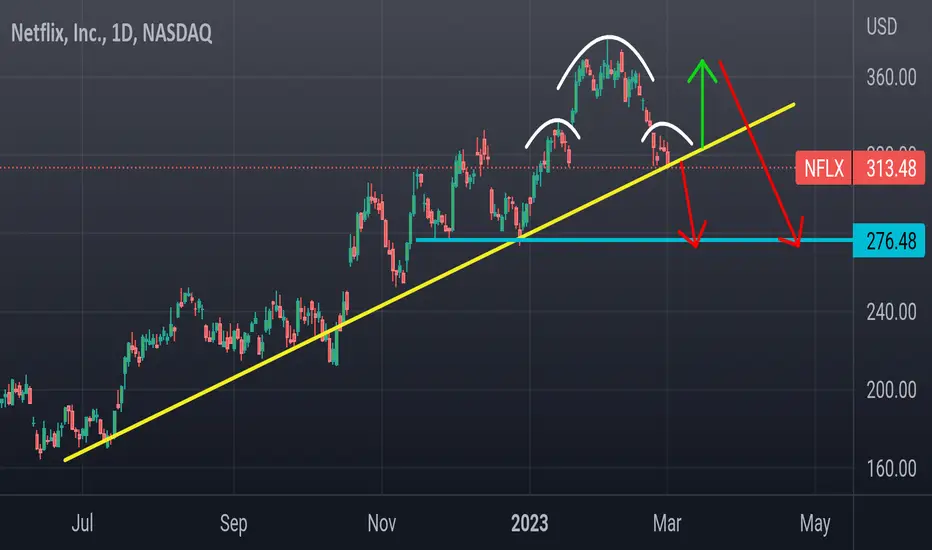
Nflx 2 movesShowing a H&S on daily chart here .
If we break below 308 we are headed for 275...
The reason I'm saying 308 is because that's where Nflx 200ema is. It's over sold on daily CCI and it's also riding lower bbands so this isn't my type of short .
I prefer door number 2 where we bounce and rally back to 350 then kick off a double top correction .
Either way NFLX is bearish if it can't reclaim 330 soon
Netflix Has Some Downside Risks- The new partnership with a major Australian studio bodes well for the company's ability to produce high-quality content.
- Netflix's recent financials have left investors doubtful of its ability to turn a profit.
- Netflix's high level of long-term debt is causing concern among investors.
Competitive Advantage and Pricing of NFLX
Netflix is a streaming giant that has seen tremendous growth in recent years. The company's earnings and revenue have consistently exceeded expectations, making it one of the most valuable companies in the world.
Netflix's original content, such as "Stranger Things," "The Crown," and "Narcos," has been particularly successful in attracting and retaining subscribers. The company has also made strategic acquisitions, such as the purchase of the Animation studio “Animal Logic”.
In addition to subscriber growth, Netflix's revenue is also driven by increasing prices. The company has raised its prices several times in recent years, and this will go into effect in 2023. This allows the company to generate more revenue per subscriber, which helps to offset the costs of producing and acquiring content.
Despite the challenges posed by the COVID-19 pandemic, Netflix has been able to maintain strong financial performance. The company's ability to adapt to the changing market conditions and its focus on producing high-quality content have been crucial to its success. As the streaming market continues to grow, Netflix is well-positioned to capitalize on the trend and maintain its position as a leader in the industry.
In terms of the competitive landscape, Netflix faces competition from other streaming services, such as Disney+, Amazon Prime Video, and Hulu. However, the company has established a strong position in the market and has a large subscriber base. If the company is able to maintain its position in the market and continue to produce high-quality content, it could bode well for its stock performance.
Netflix’s Q4 Earnings Analysis
In the last quarter of 2022, Netflix reported revenue of $7.85 billion, a 2% increase from the previous year. The company also reported earnings per share of $0.12, a significant decrease from the $1.13 reported in the same quarter of 2021. EPS had been forecasted as $0.36 and therefore it was below expectations. The main reason why Netflix was not able to meet expectations is relevant to F/X measurement on EUR-dominated debt. However, NetFlix was able to hedge volatility on EUR/USD currency pairs for their debt based on EUR. How they are dealing with this is that the company approximately has $5B of EUR bonds which provides them a natural hedge mechanism on the relative value of the EUR net income.
The main driver of Netflix's revenue growth is its subscriber base, which has been steadily increasing. In the last quarter of 2022, the company added 8 million new subscribers, bringing its total subscriber count to over 231 million. This strong subscriber growth is a testament to the company's ability to produce and acquire high-quality content that keeps its users engaged.
NetFlix had targeted an operating margin of 19%-20% based on F/X rates at the beginning of 2022. Currently, the company targets to deliver roughly 21%-22% operating margin in 2023. However, due to the timing content spend, NetFlix expects their operating margin to be down year over year (20% vs (25%).
Overall, Netflix's earnings and revenue have been consistently strong, and the company continues to grow. The company's focus on producing original content, strategic acquisitions, and raising prices has helped to drive revenue growth, which will likely continue in the future. This puts the company in a strong position to maintain its position as a leader in the streaming industry.
Regional Breakdown
In the United States, Netflix has the largest subscriber base of any country, with over 60 million subscribers. This is due in part to the fact that the company was founded in the United States, and it has been able to establish a strong foothold in the market early on. In addition, the high penetration of broadband internet in the US has made it easier for Netflix to reach its target audience.
In Asia, Netflix has faced more challenges in establishing a strong subscriber base. The company has had to contend with stiff competition from local streaming services, as well as cultural and linguistic barriers. However, Netflix has been able to make inroads into the Asian market by producing local content and making strategic partnerships with local media companies.
In Latin America, Netflix has been able to establish a strong presence in countries such as Brazil and Mexico. The company has been able to build a large subscriber base in these countries by producing localized content and making strategic acquisitions of local media companies.
In Africa, Netflix has faced some challenges in building a subscriber base due to a lack of broadband internet infrastructure and low purchasing power in some countries. However, the company has been able to make inroads in the African market by partnering with local media companies and producing localized content.
Overall, Netflix has a strong global presence, but its subscriber base and financial performance vary by region. The company has been able to build a large subscriber base in the United States, Europe, and Latin America, but has faced more challenges in Asia and Africa. The company continues to expand its global reach and adapt to regional market conditions.
Cashflow and Capital Structure
Netflix's cash flow and capital structure are closely related to its overall financial performance. The company generates cash flow through its operations, which it uses to fund its growth and expansion.
In terms of cash flow, Netflix has consistently been generating positive cash flow from operations. In the last quarter of 2022, the company reported cash flow from operations of $443.858 Million, which was a decrease from $556.810 Million. This cash flow is generated primarily through subscription revenue, which accounts for the majority of the company's revenue.
Netflix's capital structure is primarily composed of debt and equity. The company has been using debt to finance its growth and expansion. As of December 2022, Netflix's debt stood at $14.3 billion, with the majority of it being in the form of long-term debt.
In terms of equity, Netflix has been using a combination of internal funds and equity offerings to raise capital. The company has been able to raise capital through several equity offerings over the years, which has helped it to grow and expand its business.
As the company continues to invest in content and expand its global reach, it will continue to generate positive cash flow, but it is also likely to continue to rely on debt to finance its growth.
Overall, Netflix's cash flow and capital structure are closely related to its overall financial performance. The company generates positive cash flow from its operations, which it uses to fund its growth and expansion. Its capital structure is primarily composed of debt and equity, with the company using a combination of internal funds and equity offerings to raise capital.
Technical Snapshot of Netflix
2022 was a devastating year for Tech stocks due to the high inflation rates and demand for commodities. These might be some reasons why Tech stocks were not shining in 2022, but it is undeniable the fact that there are always opportunities to benefit from in the market. Therefore, having evaluated NetFlix’s current earnings ratios and expectations, it can be said that the Pivot point at $300 will be a determinant of which way the stock tends to move.
Final Thoughts
I expect a high level of volatility and believe that the current tendency for commodities will be maintained through 2023. Therefore, some hedging strategies might be used for technology stocks to locate yourself on the safe side of trading through earnings seasons. Netflix has already reached its mature growth phase therefore the company needs to come up with new ideas, projects, or acquisitions that make everyone impressed. According to Netflix’s latest financial report, the current Price-to-sales ratio is 4.78 whilst It is 1.92, 2.20, and 1.20 respectively for Amazon, Walt Disney, and Warner Bros. After having analyzed financial reports and these terms, I would be “Bearish” on the stock.
As always, do your due diligence on any stock before buying and selling. Happy Trading! :)

Netflix price movements repeats itselfThis is how I see Netflix, we're seen these moves happen several times.
I expect the price to move down before we continue up.

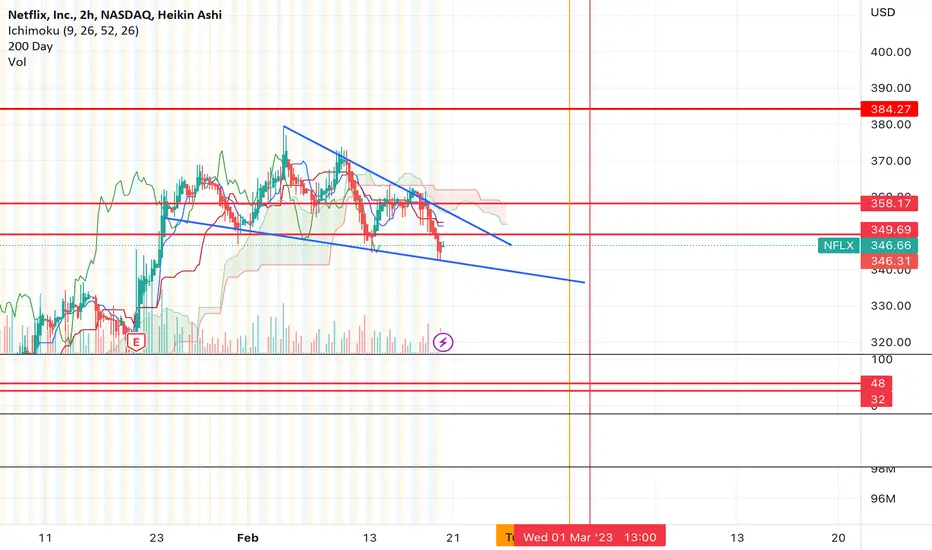
shark pattern on netflix 4 hour chartnetflix NFLIX shark pattern on 4 hour showing multiple short term targets

NFLX 2/27 - 3/3 $NFLX
If we hold 315, I like calls
PT 1: 331
PT 2: 352
PT 3: 369
If we lose 315, I like puts
PT 1: 298
PT 2: 282

NFLX Analysis#NFLX
Price playing out nicely as analyzed last week, giving us a -9.13% move since my last analysis. Price seems to show signs of rejection to the downside last Thursday, but is unable to push higher. Price is also building a lot of sell-side liquidity on the lower timeframe. I'm expecting price to continue lower, following the order flow, potentially into the bullish POI at 300.66.

NETFLIX AND SMASH?Netflix is currently sitting on an upward trendline, there are only two options for where this could go. I see this trendline bounce failing and a downward trend starting but we'll see how the markets react on Monday. Have a great weekend everyone!!

Netflix and Chill?I see price retesting the recently broken trendline, if the sell volume is high then we may see a continuation of a downtrend.

netflix 2023-02-25
netflix 2023-02-25
netflix 2023-02-25
netflix 2023-02-25
netflix 2023-02-25
netflix 2023-02-25
netflix 2023-02-25
netflix 2023-02-25
netflix 2023-02-25
netflix 2023-02-25
netflix 2023-02-25

netflix 2023-02-25netflix 2023-02-25
netflix 2023-02-25
netflix 2023-02-25
netflix 2023-02-25
netflix 2023-02-25
netflix 2023-02-25
netflix 2023-02-25
netflix 2023-02-25
netflix 2023-02-25
netflix 2023-02-25
netflix 2023-02-25

NETFLIX STOCK Netflix Holder Juts wait you cant see any impotent movement here. if not brake from upside you can see spot from down side.
Personal - Avoid and wait for new deal and level
Intraday trader can entre

NETFLIX Stock Chart Fibonacci Analysis 022323Trading Idea
1) Find a FIBO slingshot
2) Check FIBO 61.80% level
3) Entry Point > 322/61.80%


Netflix earnings after the bellNFLX Q4 December 2022 earnings are today 1/19 at 4pm. Netflix (NFLX) reported Q3 September 2022 earnings of $3.10 per share on revenue of $7.9 billion. The consensus earnings estimate was $2.11 per share on revenue of $7.8 billion. Revenue grew 5.9% on a year-over-year basis. The company said it expects Q4 earnings of approximately $0.36 per share on revenue of approximately $7.78 billion. NFLX technicals are bearish currently and it's options data is slightly bearish from neutral. I wouldn't be surprised if there's a muted downside move resulting in an IV crush for options premium tomorrow morning. Then again it can also be hedging from memory of its April 19th post market crash. It's basically a crap shoot until earnings are publicly released. Here's levels on the 1 day chart:
4th Quarter December 2022 Consensus:
EPS = $0.46
Revenue = $7.82 B
SMA200 = $245
VWMA 20 TTCATR(beta):
top = $358
R3 = $346
R2 = $334
R1 = $321
pivot = $309
S1 = $297
S2 = $284
S3 = $272
bottom = $260
1/20/23 expiry options data:
Put Volume Total 82,702
Call Volume Total 68,085
Put/Call Volume Ratio 1.21
Put Open Interest Total 284,116
Call Open Interest Total 268,671
Put/Call Open Interest Ratio 1.06
2/17/23 expiry options data:
Put Volume Total 11,401
Call Volume Total 8,160
Put/Call Volume Ratio 1.40
Put Open Interest Total 50,491
Call Open Interest Total 40,584
Put/Call Open Interest Ratio 1.24

Nflx back to 330Oversold here and closed the gap, looking for a bounce back to 50sma..
313 stop loss

SELL NETFLIX- At multi year POC, got rejected from Fib 0.382 , touched and rejected from bearish trend line.
These 3 factors, specialty the POC level, giving me (for my opinion :) ) very good opportunity to short with very good R:R.
My TP is the lower trend line of the correction channel which is also Fib 0.236.
Good Luck.

$NFLX run it back turbo $384 targetI think we just saw the short term lows for Netflix. My bias leans towards one more high before we see the market roll over.
$180-184 should be the target and it should play out before March 3rd.
Let's see...
$NFLX going down hard NFLX top looks like it wants that gap fill to 324 area. Looks like it can come quick
