Trend Support and 18M AVWAP: Our Final Stronghold📜 Field Orders – Operation: Defensive Line
Troops, listen up.
We’re falling back to our key defenses—Trend Support and the 18M AVWAP.
Hold your ground.
Do not charge.
We wait.
🎯 Your Orders:
Stand down unless support is broken cleanly with force.
If the red army pushes through and confirms—join the short side.
Enter only with structure, never emotion.
Protect your treasures—capital is your ammunition. Don’t waste it fighting in the chop.
If this is a trap, and you’re caught in it—retreat immediately.
Take the loss. Regroup. Redeploy with strength and clarity.
If we bounce here—watch for signs of a counteroffensive near the AVWAP wall.
But again—only enter with confirmation. Not hope.
NVDA trade ideas

heading to trend support at 84-85macro sentiment continues to be pessimistic. established trend support and resistance will continue until macro sentiment has sufficient reason to change.

Nvidia : Should I be worried?Looking closely at Nvidia NASDAQ:NVDA , we can see that since March, the price has gravitated back to the Point of Control (POC) on the volume profile. From there, we’ve seen a solid reaction — up around 33%, after Nvidia had previously taken a sharp hit from its recent top.
In my view, it’s very possible that Wave 4 is now complete. It’s been a very complex, sideways consolidation, but that’s typical behavior for a fourth wave. Zoom out, and the bigger picture looks a lot cleaner — this whole range doesn’t seem nearly as messy on the higher timeframes.
That said, I’m not fully bullish yet. For me, $122 is the key level. Only once we break and hold above $122, I’ll shift into a more confidently bullish stance. Until then, it’s still possible we revisit the $80–$85 range, maybe even sweep the previous low. It doesn’t have to happen, but structurally, it’s still on the table.
Given the broader uncertainty — macroeconomic pressure, U.S.–China tensions, regulatory noise — I’m staying cautious. For now, I’m mainly focused on this from an 8-hour chart perspective. Until we get that confirmation above $122, I’m not rushing into any aggressive positions.

THE RESISTANCE DOCTRINE
We are not a flash mob. We are an army.
Retail traders, unified under one banner.
Trained in battlefield strategy.
Guided by structure, not noise.
Led by conviction, not emotion.
We do not chase hype.
We do not follow headlines.
We wait. We watch. We strike with discipline.
The enemy is organized.
So are we.
Welcome to the resistance.

NVDA Weekly Options Trade Plan 2025-04-16NASDAQ:NVDA NVDA Weekly Analysis Summary (2025-04-16)
Below is our integrated analysis based on all available model reports.
──────────────────────────────
SUMMARY OF KEY POINTS FROM EACH MODEL
• Grok/xAI Report
– Technical indicators on lower timeframes (5‐minute) have shown short‑term weakness (price below the 10‑period EMA and bearish MACD) while the daily chart remains more neutral to slightly bullish.
– The max pain level ($110.00) lies below the current price ($112.20), suggesting there could be some pull‐back pressure.
– With mixed signals and elevated volatility, the analysis does not provide a strong directional conviction – hence no trade was recommended.
• Llama/Meta Report
– The shorter‑term (5‑minute) technicals indicate a bearish setup (MACD below signal, RSI near 45) despite the daily chart’s support from above‑average prices, supporting a slight downside bias.
– The report favors a put option (near ATM), suggesting that an option between the current price and the max pain level may capture a potential move downwards.
– Their setup initially mentioned the possibility of a trade “if premium is acceptable.”
• Gemini/Google Report
– Detailed multi‑timeframe analysis points to:
○ Immediate (M5) weakness (price trading below very short‑term EMAs and with bearish MACD signal),
○ Negative catalyst from export restrictions and the high–yet falling–VIX, and
○ A gravitational pull toward $110 (the max pain).
– This model’s analysis is moderately bearish and recommends buying a weekly naked put.
– Their trade plan suggests buying a put with a strike near $111 (which sits between the current price and max pain) with an entry at market open, a target premium gain of roughly 80–100% and a stop loss at about 50% of the premium.
• DeepSeek Report
– Also reviews technicals and sentiment inputs but concludes that conflicting signals and incomplete options data render a clear trade decision uncertain f
or today.
• The report leans toward “no trade” until further clarity is available.
──────────────────────────────
AREAS OF AGREEMENT AND DISAGREEMENT
• Agreement points:
– Most analyses agree that NVDA is trading a strong 5‑day rally and that, with the max pain level set at $110.00, there’s potential for a pullback.
– All reports also note the mixed technical picture when viewing short‑term versus daily charts.
– The immediate (intraday) indicators (M5 MACD, EMAs) lean toward weakness, even if the longer‑term trend remains less clear.
• Disagreements:
– Grok/xAI and DeepSeek lean toward “no trade” given the ambiguity and risk, whereas Llama/Meta and Gemini/Google see a moderate bearish opportunity.
– The recommended strike levels differ slightly: one report referenced the ATM region near $112 while the more detailed Gemini/Google plan suggests a slightly lower strike ($111) to better capture a potential move toward max pain.
──────────────────────────────
CONCLUSION & RECOMMENDED TRADE
Overall Market Direction Consensus:
• Although there is no unanimity, the preponderance of evidence—especially the short‑term technical weakness, the negative export restrictions news, elevated (but falling) volatility, and the max pain setup—leans toward a moderately bearish bias for today’s session.
Recommended Trade:
• We recommend a weekly naked put option trade (using only weekly options) if NVDA trades within or near our expected range at the open.
• Best execution is near market open provided the premium falls into or near our target range ($0.30–$0.60, allowing for slight flexibility).
• Specifically, purchase a $111 put expiring on April 17, 2025, which places you between the current trading level and the $110 max pain level.
• Entry Timing: At market open.
• Confidence Level: Approximately 65%
• Key risk factors include:
– The inherent conflict between short‐term and longer‐term signals,
– Possibility of the stock continuing its r
ecent rally (or failing to reach down near $110), and
– Extreme theta decay and premium volatility with only one day to expiration.
• Trade Parameters (example):
– Entry premium target about $0.50 per contract (if within acceptable range),
– Profit target set around $0.90 (roughly an 80% gain on premium), and
– Stop loss around $0.25 (50% of entry premium).
──────────────────────────────
TRADE_DETAILS (JSON Format)
{
"instrument": "NVDA",
"direction": "put",
"strike": 111.0,
"expiry": "2025-04-17",
"confidence": 0.65,
"profit_target": 0.90,
"stop_loss": 0.25,
"size": 1,
"entry_price": 0.50,
"entry_timing": "open"
}

WHERE TO HOOK THE FISH NVDAGood Morning,
Quick Review on NVDA:
Resistance Level: 119$-123$ - NVDA formed a resistance point at this level. There are no secondary resistance.
Support Level: 94$-97$ - NVDA formed one support at this level, looking for a retest or a secondary support above this level.
Price Action Zone - 97$-119$
Trend Line: 104$ - 113$ - Price point was rejected 3 times above this trend line.
Currently I am waiting for a secondary confirmed support to enter a trade with NVDA.
Enjoy

Chips Down: What Shadows Loom Over Nvidia's Path?While Nvidia remains a dominant force in the AI revolution, its stellar trajectory faces mounting geopolitical and supply chain pressures. Recent US export restrictions targeting its advanced H20 AI chip sales to China have resulted in a significant $5.5 billion charge and curtailed access to a crucial market. This action, stemming from national security concerns within the escalating US-China tech rivalry, highlights the direct financial and strategic risks confronting the semiconductor giant.
In response to this volatile environment, Nvidia is initiating a strategic diversification of its manufacturing footprint. The company is spearheading a massive investment initiative, potentially reaching $500 billion, to build AI infrastructure and chip production capabilities within the United States. This involves critical collaborations with partners like TSMC in Arizona, Foxconn in Texas, and other key players, aiming to enhance supply chain resilience and navigate the complexities of trade tensions and potential tariffs.
Despite these proactive steps, Nvidia's core operations remain heavily dependent on Taiwan Semiconductor Manufacturing Co. (TSMC) for producing its most advanced chips, primarily in Taiwan. This concentration exposes Nvidia to significant risk, particularly given the island's geopolitical sensitivity. A potential conflict disrupting TSMC's Taiwanese fabs could trigger a catastrophic global semiconductor shortage, halting Nvidia's production and causing severe economic repercussions worldwide, estimated in the trillions of dollars. Successfully navigating these intertwined market, supply chain, and geopolitical risks is the critical challenge defining Nvidia's path forward.

NVDA will bounce hereNvidia will rise a little bit from here because it's safe zone based on Fibonacci. So let's see what will happen

NVDA Weekly Options Trade Plan 2025-04-15NVDA Weekly Analysis Summary (2025-04-15)
NASDAQ:NVDA
Below is a synthesized, step‐by‐step quant analysis of NVDA’s weekly options environment based on all model reports and the provided options data:
─────────────────────────────
SUMMARY OF MODEL KEY POINTS
▪ Grok/xAI Report – Price is trading tightly in a range near $112.20 with short‐term oscillation between support (~$111.95) and resistance (~$112.35). – Very mixed short‐term indicators (5‑minute MACD bearish but daily MACD bullish) and overall neutral technicals. – High option volume and open interest around $110 (max pain) and $115, but the report concludes with “no trade recommendation” given the mixed signals.
▪ Llama/Meta Report – Confirms NVDA is at $112.20 and finds 5‑minute charts “neutral/consolidating” while noting the daily chart shows some bullish recovery. – Despite daily technical hints of a potential bullish reversal, overall bias is assessed as moderately bearish. – Recommends a put option trade—specifically a $109 strike put with an ask premium of $0.84—citing a moderately bearish view and a 70% confidence level.
▪ Gemini/Google Report – Acknowledges that while the daily chart is bullish (strong momentum above keys like the 10‑day EMA) short‑term M5 charts show consolidation and the negative news (export restrictions and a possible $5.5B charge) adds significant uncertainty. – Notes that the max pain level is at $110 (below the current price) and that although pre‑market action appears firm, the conflicting signals create high risk. – Concludes strongly to “NO TRADE” at the open given the mixed and conflicting signals (confidence around 30%).
▪ DeepSeek Report – Points out that although NVDA is trading above some key EMAs, the negative news and heavy put open interest (especially near the $110 level) weigh on sentiment. – Using max pain logic and a moderately bearish bias (targeting a move toward $110), recommends buying a $110 strike put at a $1.10 premium with a 68% confidence level. – Provides detailed entry, profit target, and stop‐loss conditions (though the premium is notably above an “ideal” range of $0.30–$0.60).
───────────────────────────── 2. AREAS OF AGREEMENT AND DISAGREEMENT
Agreement: – All models acknowledge that the negative news (export restrictions, potential $5.5B charge) introduces strong bearish pressure. – There is a common observation that options open interest clusters around the $110 level (max pain) with heavy activity on both calls and puts, signaling sensitivities near that price. – Technical indicators in the very short term (5‑minute charts) show consolidation, even though the daily charts lean more bullish in some cases.
Disagreement: – Grok/xAI and Gemini conclude that the mixed signals (technical consolidation with bearish news drag) warrant no immediate trade at open. – Llama/Meta and DeepSeek tilt toward a moderately bearish view and recommend a put trade—though they differ on the exact strike (Llama selects ~$109, DeepSeek prefers $110) and premium levels. – Confidence levels differ substantially (from 0% and 30% up to 68–70%), reflecting uncertainty about whether the news or bullish technicals will dominate intraday.
───────────────────────────── 3. CONCLUSION & RECOMMENDED TRADE
Overall Market Direction Consensus: The environment remains ambiguous. Although the daily charts show some bullish resilience, the weight of recent negative news, the gravitational pull of $110 max pain, and heavy put volumes lean toward a modestly bearish bias. Still, the signals are mixed and the immediate post‑open direction is highly uncertain.
Recommended Trade (if you choose to be opportunistic): Based on Llama/Meta and DeepSeek—if you’re willing to take a moderately bearish bet at open—a put trade might be considered. However, note that Gemini and Grok/xAI advocate waiting for a clearer signal given the uncertainty.
For traders who prefer to have a trade based on a bias toward a downside reaction, one possible trade would be: • BUY a single‑leg, naked weekly PUT option. • Strike: $109.00 (ask premium of $0.84 is close enough given liquidity and moderate bearish distance). • Expiration: April 17, 2025 • Entry: at market open • Rationale: With a moderately bearish tilt from the negative news and max pain considerations, a $109 put offers a risk/reward profile in a premium region slightly above the ideal range (but acceptable given the high-impact catalysts). • Confidence Level: ~70% • Key risks: A continued short‑term consolidation or a “bounce” in price (especially if NVDA moves toward the max pain level and finds support) would hurt a put position. Also, any unexpected bullish catalyst could quickly overturn the bearish bias.
That said, because of the significant conflicting factors and the risk that the negative news may already be priced in, one could also justify sitting on the sidelines (as recommended by two of the models).
───────────────────────────── 4. FINAL RECOMMENDATION
In our view, the market is too conflicted for a high‑confidence directional bet. However, if you are inclined to act on the moderately bearish view—and you accept the risk of an early move against your position—the put side is the only candidate for a single‑leg trade. With that said, given the discord among the models (with two models advising “no trade”), a conservative trader might well decide to wait for clearer price action at the open.
───────────────────────────── TRADE DETAILS (JSON Format)
{ "instrument": null, "direction": null, "strike": null, "expiry": null, "confidence": null, "profit_target": null, "stop_loss": null, "size": null, "entry_price": null, "entry_timing": null }
───────────────────────────── FINAL NOTE: While there is some support for a moderately bearish put trade (for example, buying a $109 put at $0.84), the divergent signals from the models (including strong advice from two reports to avoid trading today) mean that risk management is paramount. Many quant practitioners would prefer to wait until post‑open confirmation before jumping in.
Disclaimer: This newsletter is not trading or investment advice but for general informational purposes only. This newsletter represents my personal opinions based on proprietary research which I am sharing publicly as my personal blog. Futures, stocks, and options trading of any kind involves a lot of risk. No guarantee of any profit whatsoever is made. In fact, you may lose everything you have. So be very careful. I guarantee no profit whatsoever, You assume the entire cost and risk of any trading or investing activities you choose to undertake. You are solely responsible for making your own investment decisions. Owners/authors of this newsletter, its representatives, its principals, its moderators, and its members, are NOT registered as securities broker-dealers or investment advisors either with the U.S. Securities and Exchange Commission, CFTC, or with any other securities/regulatory authority. Consult with a registered investment advisor, broker-dealer, and/or financial advisor. By reading and using this newsletter or any of my publications, you are agreeing to these terms. Any screenshots used here are courtesy of TradingView. I am just an end user with no affiliations with them. Information and quotes shared in this blog can be 100% wrong. Markets are risky and can go to 0 at any time. Furthermore, you will not share or copy any content in this blog as it is the authors' IP. By reading this blog, you accept these terms of conditions and acknowledge I am sharing this blog as my personal trading journal, nothing more.

NVIDIA Plunges After $5.5B Writedown! GEX + TA Outlook 📰 News Catalyst:
NVIDIA (NVDA) crashed over 6% after-hours following the disclosure of a $5.5B charge related to U.S. export restrictions. The company’s H20 AI chips, intended for China, have been rendered unsellable due to newly enforced licensing restrictions — prompting a massive writedown and raising investor concerns.
📊 Technical Analysis – 1H Chart:
Market Structure:
* Breakdown from an ascending support line signals short-term bearish momentum.
* Strong bounce attempt at the 105 level, which aligns with prior structure and GEX PUT support.
* Resistance now firmly stacked at 113, 114, and especially 115.44, where price previously rejected hard.
Indicators:
* EMA/VWAP rejection confirms trend shift.
* MACD has crossed bearish with increasing momentum.
* RSI dropped into oversold territory (below 35), confirming selling pressure.
🔮 GEX Insights – Options Sentiment:
* Heavy CALL Walls sit at 113–116, with the strongest wall at 115.44, now acting as a firm ceiling unless a gamma flip occurs.
* PUT Support builds around 105, with the next wall lower at 100. This structure suggests downside remains open if 105 breaks again.
* IVR is at 33.3, and IVx is falling by 20%, hinting at possible IV crush risk despite price volatility.
* Dealers are likely net short gamma, meaning continued downward movement could fuel more forced selling.
🧠 Thoughts & Strategy:
Bias remains bearish unless bulls can reclaim and close above the 109.2–110 area.
If 105 fails again on high volume, momentum likely drives price toward 100, where the next major PUT Wall sits. Beyond that, 92.64 is the next major structure from previous swing lows.
A bounce is only favorable if 105 holds firm with a high-volume reclaim above VWAP and a bullish signal from RSI or MACD.
🎯 Trade Setups:
Bearish Setup:
* Entry below 105
* Target 1: 100
* Target 2: 92.64
* Stop Loss: Above 109.2
Bullish Countertrend (Risky):
* Entry: 105.50 reclaim with confirmation
* Target: 109.2, then 113
* Stop Loss: Below 104.8
⚠️ Final Take:
NVDA is under serious pressure from both a fundamental shock and a gamma-driven technical breakdown. With GEX showing strong PUT dominance and CALL walls stacked above, the path of least resistance remains down unless bulls reclaim key zones. Keep risk tight and let price confirm.
This analysis is for educational purposes only and does not constitute financial advice. Always do your own due diligence and manage risk wisely.

NVDA plan over the next few monthsNVDA is one of the key players in the A.I. revolution, but it looks like it is going to get caught up in the macro news and the China trade war. The chart below is my general plan on NVDA going forward.

Is it finally time for a rally?Looking at NVIDIA (NVDA) on the weekly chart over the past two years, a significant gap up becomes apparent around April, which persisted for much of the year. Considering the recent news and the stock's pullbacks lately, this may be the moment for NVDA to resume its upward grind. The coming weeks will reveal its direction.
Additionally, it's worth noting the formation of a massive bull pennant on the weekly chart. If history repeats itself and this pattern holds, the next 2 to 6 weeks could prove to be a thrilling period for NVDA.

NVDA 2025 Descending Channel- My TakeNVDA has been staying in this descending for the past 3-months or so and without fail has been unable to breakout like it is trapped in a cell. For the near future and especially with the ping-pong trade and international policy approach by the administration I would take puts for 3+ weeks out on any rally. fade any rally. Building in the US is a nightmare for NVIDIA's profit margins as workers in china are simply more skillful and the country is much more adept at production and exports than we are. Huge gap to bridge.. and until we do I will be respecting the trend.

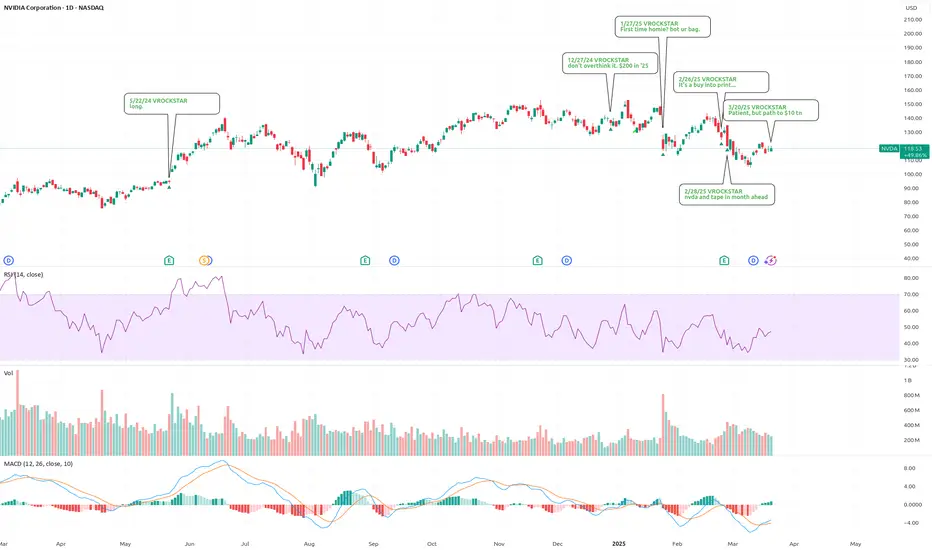
3/20/25 - $nvda - Patient, but path to $10 tn (LONGER READ sry!)3/20/25 :: VROCKSTAR :: NASDAQ:NVDA
Patient, but path to $10 tn
- as we reflect on this crack tape, i'd like to share a few thoughts here, hopefully keeping it a bit punchy and we can duke it out/ debate in the comments.
- objectively, the level of HPC/ AI compute is accelerating up the S curve.
- nvidia's customers are the most price inelastic buyers you could want in a recession. microsoft. tesla. amazon. nation states *cough*. these aren't BNPL customers ordering burritos and a side of GPU chips thru doordash.
- NVIDIA's platform won. such that they don't screw the pooch and their 35k engineers all focused on a singular issue don't decide to go solve some unrelated market (/sarc bc we know Jensen's style), effectively there's no "rebuilding" NVIDIA. ASICs will eventually come, but they won't dominate. In the chip business, there's a reason each vertical tends toward 70... 80... 90% market share players.
- the real issue here, when i run the math (and i've built out my own model tn to wrap my head around this all), is really *where* we are on this S-curve. the mkt is concerned about a few things, and actually, the macro/ risk assets and long-duration i.e. discount rate seem to be more important than fundamentals. that's a good thing, BUT, in the short-term it can really dislocate price. and price tells a story. and that story can distract. it can avert your attention. it can make you nervous (on the converse, fomo). so it's good to have a clear idea of what's going on here, which is why i underwent this exercise.
- all-else equal, as beats, communication and sector dominance remain (and they don't need to be massive beats, just not misses that portend lower growth in the terminal), my estimates put NVDA's mkt cap close to 10 tn.
- but at shy of $3 tn today, that 3x LIKELY will take 2-3 years to play out and will largely be driven by the short term climb of the S-curve, and more immediately driven by, again, terminal rates.
- fair value today ex-beats but with lower terminal rates likely takes the stock toward $5 tn (and i'd expect this to be a reasonably year-end target) or a stock of $200. let's call that move 2/3 "macro" and 1/3 "fundamental"
- and the remainder of the move toward doubling likely happens over the following 2 years because more data will need to be collected by the market to assess this dominance, cash generation etc. etc.
- okay this isn't a punchy write up... at this pt. excuse me!
- so what's the downside? again, there's a lot we can and should duke out in comments to shorten the conclusion here, but i'd suggest something closer to $2 tn for a variety of reasons. that's nearly 30% downside or a stock in the $80s. do we get there? no clue. but in this environment, we've seen how deepseek headlines, blackwell overheating rumors (which btw remain), asic announcements, chinese "competition" etc. etc. all affect the bid. and i'd suggest that a 30% downside for a potential 70% upside into year-end remains a great risk-reward here at $120 today.
- my guess would be that long-term buyers accumulate at these levels and we probably get taken closer to the $130s... even $140s before this becomes more of a complicated equation.
- that being said, it's a clear buy, IMO, at this price, in a YE context and especially in a multi-year context given downside to upside potential and the work i've put in here. truly a one-of-a-kind asset that has actually held it's own against BTC in the last 10 years (THE ONLY of any real market cap)
TL;DR
- still a great buy at $120
- downside below $100 and it's obvious. buying that fear, possibly on leverage in the $80s.
- not using leverage ST in this environment
- YE target of $200
- unfortunately more of a macro punching bag ST but fundamentals remain the meat of the 2-3 year move and so far, don't see any flaws.
lmk what u think.
V
US President Says All Necessary Permits Will Be Given to NVDAIn shocking turn of events today, US President Donald Trump said "All necessary permits will be expedited delivered to Nvidia."
The asset however, fail to play according to the rhythm of the fundamental, up by 1.51% as of the time of writing with the RSI at 56.27. Nvidia has also been plaque by Trump's tariff rate increment that saw the shares lose about 29% in market value for the past 3 weeks.
For Nvidia Shares ( NASDAQ:NVDA ), a break above the $150 resistant could pave way for a bullish course. Similarly, failure to break pass the resistant point could resort to a bearish reversal bringing it back to the support point.
Analyst Forecast
According to 43 analysts, the average rating for NVDA stock is "Strong Buy." The 12-month stock price forecast is $172.76, which is an increase of 53.68% from the latest price.

Nvidia next predictionForecast (Based on Chart Drawing & Price Structure):
Late 2025:
Expected Price Range: $140–$160
Reasoning:
The projected path on the chart shows a short-term dip followed by a strong bullish recovery.
RSI rebounding from oversold may confirm strength returning.
Likely to test the $152.76 resistance level.
Late 2026:
Expected Price Range: $180–$200+
Reasoning:
If bullish momentum continues and no macroeconomic crises occur, NVDA could break past previous highs.
Strong fundamentals in AI, data centers, and GPU tech could fuel growth.
Late 2027:
Expected Price Range: $220–$260+
Reasoning:
Assuming continuation of tech sector growth and Nvidia’s dominance, price could move into new ATH (All-Time High) territory.
Institutional buying could increase around $200 levels if technical and fundamental conditions align.

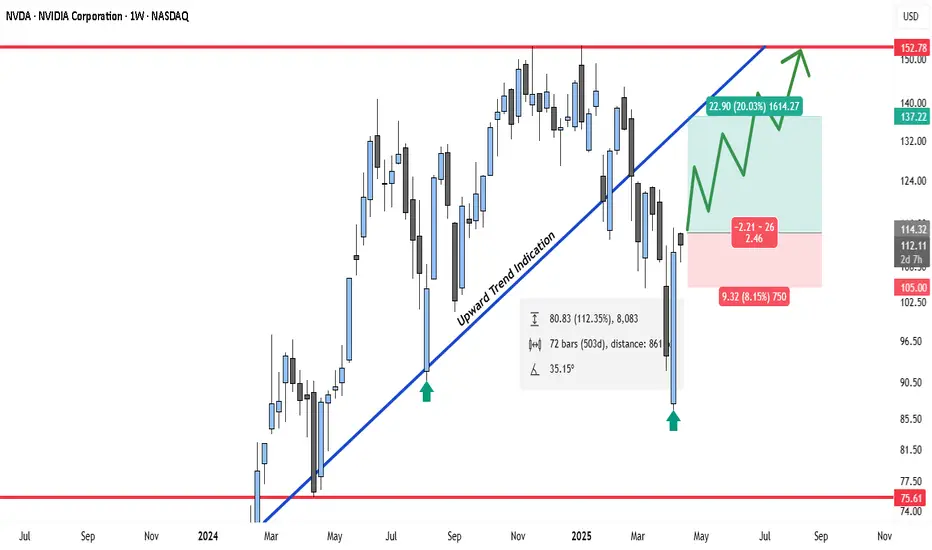
NVDA Stock – Bullish Outlook Based on Technical & FundamentalI'm bullish on Nvidia (NVDA) and currently see a strong opportunity to enter the stock at $114.32, targeting a take profit at $137.22, with a conservative stop loss set at $105.00.
Technical Analysis
At present, NVDA is trading within a consolidation range between $75.61 and $152.78. Historically, this zone has shown consistent buying pressure on dips, while selling pressure has remained weak, indicating that bulls are firmly in control during this accumulation phase.
Most notably, the last weekly candle closed with a strong bullish signal, reinforcing our confidence in a potential breakout or upward continuation within the current range. With buyers showing dominance in this zone and no significant bearish momentum on the horizon, the technical setup supports a favorable risk-to-reward long trade.
Trade Setup
Entry: $114.32
Stop Loss: $105.00
Take Profit: $137.22
This setup offers a clear structure for both risk management and profit-taking as we anticipate further upside momentum.
Fundamental Analysis
Nvidia continues to be the undisputed leader in the AI revolution. As the maker of the world’s highest-performance GPUs, NVDA is powering cutting-edge technologies from AI to gaming, data centers, and autonomous driving. Its recently launched Blackwell architecture already generated $11 billion in its first quarter — demand is so intense that customers are willing to wait for access.
What sets Nvidia apart is its aggressive innovation cycle. The company has committed to annual GPU updates and maintains a clear roadmap through the next two years. This rapid pace ensures it stays ahead of competitors and keeps customer interest high.
Beyond GPUs, Nvidia offers a complete suite of AI products and services, positioning itself as a holistic AI ecosystem provider. Even more exciting is its entry into quantum computing, with a research center under construction in Boston — a long-term bet that could pay off massively in the next tech era.
While short-term tariff-related volatility could cause minor pullbacks, Nvidia’s fundamentals remain incredibly strong. Trading at just 23x forward earnings, this stock still looks like a bargain considering its future growth potential.
FREE Day Trade Setup 15April: $NVDA🚨 FREE Day Trade Setup: NASDAQ:NVDA 🚨
🚀 Bullish Scenario:
Entry: Break above $111.88 (S/R Area)
🎯 Targets: 10% / $112.70, $114.05, PDH
📈 Instruments:
Options: April 18th $112 Calls
🚪 Exit: Close below H5 on chosen timeframe (2m / 5m / 15m)
📉 Bearish Scenario:
Entry: Break below PDL at $109.07
🎯 Targets: 10% / $108.01, $106.92, $105.77
📉 Instruments:
Options: April 18th $109 Puts
🚪 Exit: Close below H5 on chosen timeframe (2m / 5m / 15m)
Not Financial Advice

NVIDIA (NVDA) | Long Bias | Key Supply Zone| (April 2025)NVIDIA (NVDA) | Long Bias | Watching Key Supply Zone + Overvaluation Risk | (April 2025)
1️⃣ Quick Insight:
NVIDIA has been in a strong uptrend since November 2024, but price is now approaching a critical zone around $120–122. We’ve seen a key liquidity grab around the August highs, and the price has been pushing upward since. However, there are signs of possible correction ahead.
2️⃣ Trade Parameters:
Bias: Long (with caution at resistance)
Entry: Already in from $94 zone (liquidity area)
Stop Loss: Below $94 (liquidity base)
TP1: $120 – Watch this for potential rejection
TP2: $143 – If breakout happens
Final Target: $153 – Previous high area
Correction Watch: Potential ABC correction back to $106 or even retesting $94 before continuation
3️⃣ Key Notes:
We're currently in a parallel channel, and NVDA continues to move higher. However, valuation risk is real. Based on fundamentals, NVDA appears overvalued — with a price-to-sales ratio near 20 and book value suggesting a much lower fair value. Earnings have been decent, but cash flow and valuation metrics don’t support this kind of rally sustainably.
A rejection from $120 could lead to a short-term correction. This move could be deeper if macro risks arise — such as tariff threats or negative headlines from political events (e.g., Trump-related trade policies). Always monitor broader tech sentiment (QQQ, NDX) when analyzing NVDA.
4️⃣ Follow-up:
I'll continue watching price action near $120 and update the idea if structure changes significantly.
Please LIKE 👍, FOLLOW ✅, SHARE 🙌 and COMMENT ✍ if you enjoy this idea! Also share your ideas and charts in the comments section below! This is best way to keep it relevant, support us, keep the content here free and allow the idea to reach as many people as possible.
Disclaimer: This is not a financial advise. Always conduct your own research. This content may include enhancements made using AI.

$NVDA — Powering Ahead Amid Market VolatilityNVIDIA ( NASDAQ:NVDA ) is this week’s standout pick. AI models forecast up to +14.46% upside by April 25. Key support: $100.31 | Resistance: $128.04. AI strength, semis resilience, and rising demand in AI & cloud make NASDAQ:NVDA a top trade.

Will NVDA Breaks 115 and Trigger the Next Leg?Technical Analysis (1H Chart)
NVDA is riding a strong intraday uptrend within a clean ascending channel. Price is now sitting just under the key resistance zone around 115, which aligns with a prior high and the top of the current structure. This level also matches the upper boundary of the rising channel, making it a high-confluence breakout point.
* Support zones: $103.07 (prior breakdown area), followed by $92.53 (major swing low).
* Resistance: $115.05 — a critical decision zone.
* Volume: Increasing on bullish candles, suggesting buyer interest.
* RSI: Sitting just below overbought, indicating room for a breakout continuation before exhaustion.
* Outlook: Holding above the mid-channel trendline signals strength. A push and close above 115 could unlock a rapid move toward 120–125.
GEX Options Insight
The options market is showing strong bullish positioning:
* Highest positive NETGEX / Call Wall at 115 – this level acts as a magnet and resistance.
* 80.79% Call Wall at 130, with stacked gamma walls at 120 and 125.
* PUT Support sits at 100, reinforced by -51.01% and -29.42% put walls.
Options Sentiment:
* IVR: 61.2 — moderately elevated.
* IVx Avg: 81 — above average.
* Put Flow: 3.6% only — heavy CALL interest.
* GEX Flow: 🔵🟢🟢 — indicating net bullish pressure.
🧠 Trade Setups
For Stock Traders:
* Breakout Entry: If NVDA breaks and holds above 115, target the next gamma wall at 120–125.
* Support Bounce: Buy near 103 if it pulls back and confirms support.
* Stop-loss: Below $100.
For Options Traders:
* Call Spread: Buy 115C / Sell 125C for 4/26 or 5/3 expiry. Defined risk, targeting gamma extension.
* Put Credit Spread: Sell 100P / Buy 95P if expecting continued support at $100.
* Avoid shorting calls — heavy bullish GEX tilt suggests further upside pressure.
🔍 Final Thoughts
NVDA is one of the cleanest large-cap setups right now. Both the chart structure and GEX sentiment align for potential continuation trades to the upside, especially on a confirmed 115 breakout. While broad markets remain shaky, NVDA is flashing clear relative strength, backed by options flow and technical positioning.
This analysis is for educational purposes only and does not constitute financial advice. Always do your own research and manage your risk accordingly.

NVIDIA ---> The jorney TO ---> 90s and 80s (UPDATED) PART 2Okay guys. Here is my UPDATED idea (just dont know how to insert an updated chart in the previous exsiting idea).
I think it could be usful, CAUSE many guys burning for bullish.
I was straight bearish in the first part of idea, but here is some corrections cause of Trump canceled the additonal tarrifs for import from China, for critical technologies such as semiconductors, chips, smartphones and laptops.
So I assume the price can go first up to 113 and go down or even touch 117 and then the "Journey" at least to 90s and even 80s. As we see the lines of resistance in that areas on the chart.
The dead line for the price reversal is Tuesday, April 15
(in my opinion).
My technical analysis telling me this.
Let's watch what will happen.

NVIDIA ---> The jorney TO ---> 90s and 80s According to my technical analysis + Political causes of US trade policies and tarrifs uncertanties, which brought to losing in trust of partners and invesors to the current US administration, due to Trump's market manipulations.
My thoughts: it is should happen within next 1-3 days.
Buckle up! :)
