NVIDIA: Time for a Graphic Comeback?🔍Analysis:
Following up from a previous breakdown, NVIDIA has now tapped into a high-probability Weekly Order Block (OB) just above the sell-side liquidity zone at $88.97. This level also aligns with a structural area of support, making it a prime zone for a potential bullish reversal.
Key signs:
Price is showing early signs of displacement from the OB.
If this zone holds, we could be looking at a 77% move back up to the buyside liquidity at $157.92.
Watch for a strong weekly candle close above $96.30 to confirm the bounce.
🛑 Invalidation:
If price fails to hold this OB and breaks below $88.97, expect a deeper move into the $76.06 zone.
💡 Summary:
Patience is key. We’re sitting on a solid base for a potential bullish push — now it’s all about the confirmation candle. 📊
DYOR — Don't just HODL, study the chart!
NVDA trade ideas

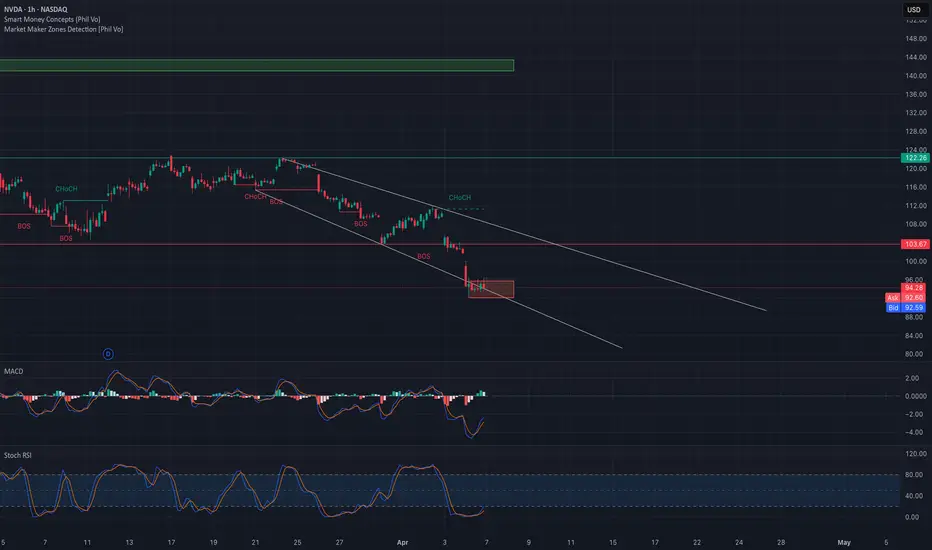
NVDA Technical Analysis – April 9, 2025NVIDIA (NVDA) just got rejected at the top of a falling wedge channel on the 1H chart and is showing clear signs of continued bearish pressure. After testing a key resistance around the $102–$103 zone, price has sharply reversed and is now threatening to revisit lower trendline levels.
Market Structure & SMC Insight:
* NVDA remains in a strong downtrend with price confined in a descending wedge.
* There was no confirmed CHoCH (Change of Character) or BOS (Break of Structure) indicating strength—only a lower high rejection.
* A red resistance zone remains around $103.70, while major support lies around $86.74.
* MACD is curling down after a bearish cross.
* Stoch RSI is pointing lower from the mid-zone, signaling more downside may be ahead.
* Volume has increased on this rejection, giving the move more credibility.
TrendInfo Sentiment Summary:
* MA: Bearish (-2.21%)
* DMI: Bearish (38.33)
* RSI, MACD, Stoch: All showing bearish confirmation.
* DPR (Directional Pressure Ratio): Bearish (43.5%)
* Fear & Greed: Fear (-15.78), overall Sell rating of 75%.
This suggests that short-term traders are risk-off and sentiment is skewed toward more downside.
Options GEX Analysis (Gamma Exposure & Sentiment):
* Current GEX shows strong PUT dominance at 28%, aligning with a bearish directional expectation.
* IV Rank (IVR) at 107.2 with IVx avg at 108.7 indicates high volatility; premiums are rich, great for credit spreads or directional put plays.
* Key Put Support at $90 with heavy GEX clustering below. This is your downside magnet.
* Call resistance sits near $102–$105 range, aligning with the recent rejection. Gamma walls at $108–$111 cap the upside.
Trade Scenarios:
Bearish Scenario:
* Rejection confirmed. If NVDA breaks $94 again, a fast drop to $90 and even $86 support is on the table.
* Put Options with strikes at $90 or debit spreads can work well.
* Watch for continuation volume confirmation.
Bullish Reversal Setup (Low Probability for Now):
* Needs a reclaim of $103.70 with volume.
* A CHoCH + strong bullish candle would trigger potential upside targets of $108 and $111.
* Call debit spreads or long shares only if reversal is confirmed.
My Thoughts: NVDA continues to reflect sector-wide weakness in semis. Without strong market support, the path of least resistance remains down. Given the macro volatility and sentiment tilt toward fear, it's wise to position conservatively and trade with tight risk.
Final Suggestion:
* Put Bias Active
* Avoid heavy call exposure unless reclaim of $103 occurs
* Sell premium if IV stays elevated (e.g. credit spreads)
Disclaimer: This analysis is for educational purposes only and does not constitute financial advice. Always do your own research and manage risk accordingly.

NVDA 4/8/25NVDA showing a rejection at previous support.
Dropped below trend channel and appears to be confirming a rejection there as well
I want it @ $75-80 for sizeable buy.

NVDA UptrendNVDA The rise starts at point 87.50 and continues to rise after exceeding the level of 93

An end to Jensen Huang's prancing.Jensen Huang is one hang of a gasbag. Have you ever seen a human gasconading like that? Saying AI will eliminate the need for coding was Huang hell of an idiotic statement. And the the leather jacket is like a tiny tube on a mole. Just like his company's oversized stock price. Final target is around 50 usd.

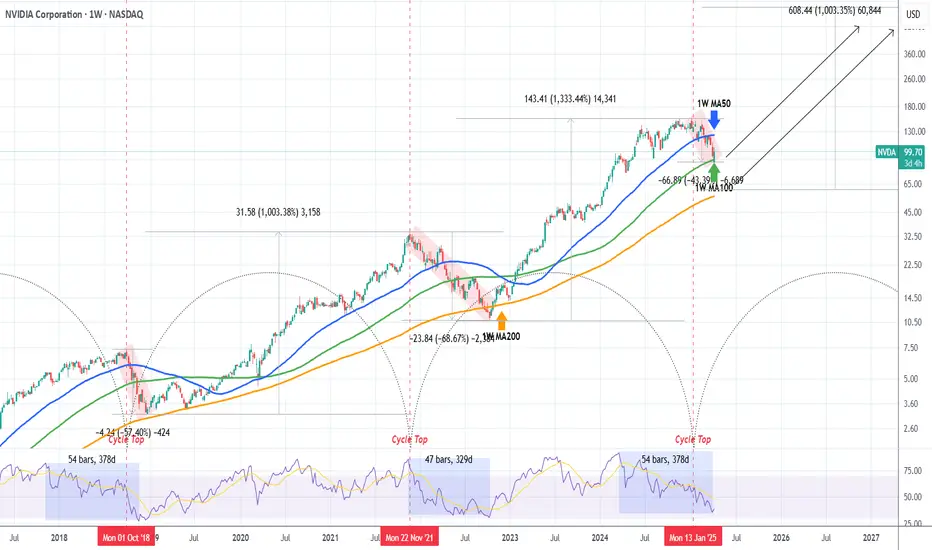
NVIDIA on Bear Market territory. Will the 1W MA100 save the day?NVIDIA Corporation (NVDA) has officially entered Bear Market territory as it has declined by almost -45% from the January 2025 All Time High (ATH) and just hit its 1W MA100 (green trend-line) for the first time since the week of January 30 2023.
This is the strongest correction the stock has seen since the 2022 Inflation Crisis and based on the Time Cycle Indicator of the last two Cycle Tops, the week of Jan 06 2025 falls indeed on the third count. This high degree of symmetry isn't only present on the price action but on the 1W RSI sequence itself as the current time range from the RSI High (March 18 2024) to today's Low is fairly consistent (54 weeks, 378 days) with the top-to-bottom range of the previous two Bear Markets, 2022 and 2018 (red Channel Down patterns).
So far the current correction looks similar to the September - December 2018 as not only their RSI counts are similar but both are more aggressive and fast than the 2022 Inflation Crisis. The 2018 correction though didn't top on the 1W MA100 but almost reached the 1W MA200 (orange trend-line) before making a bottom, but it did so in less than 2 months and declined by -57.40%. The current correction is already running for 3 months.
So what remains to be seen is if the 1W MA100 will manage to hold and kick-start a bullish reversal on its own, despite this correction being 'only' -43.39%. The 1W RSI dropped close enough to 30.00 (the oversold limit) though, which has historically been a very reliable indicator for a long-term buy on NVDA.
If those work in favor of the 1W MA100 holding, expect to see a strong rebound, that will confirm the new Bull Cycle with a break above the 1W MA50 (blue trend-line) and can technically aim for at least a +1000% rise from the bottom, as both previous Bull Cycles did.
If the 1W MA100 fails, we expect a bottom by the end of June 2025 around the 1W MA200 between $65-60. Again a +1000% rise from that level is technically plausible, potentially giving a Target estimate of at least $660.
-------------------------------------------------------------------------------
** Please LIKE 👍, FOLLOW ✅, SHARE 🙌 and COMMENT ✍ if you enjoy this idea! Also share your ideas and charts in the comments section below! This is best way to keep it relevant, support us, keep the content here free and allow the idea to reach as many people as possible. **
-------------------------------------------------------------------------------
💸💸💸💸💸💸
👇 👇 👇 👇 👇 👇
NVDA: Sell ideaSell idea on NVDA as you can see on the chart because we have a spring effect on vwap indicator.

Nvidia Price target $90 by July 2025Nvidia Price target $90 by July 2025.
If a recession hits, Nvidia could fall to $90. GET READY


NVIDIA Support Breakdown, Targeting Lower LevelsFrom a technical perspective, the chart shows a break of daily support at 126.86 and 129.51. This could lead to a long squeeze and increased selling pressure, targeting levels of 109.9, 100.44, and 90.56. A sell position between 135.05 and 129.51 might be considered, but a stop loss at 148.95 is crucial.

NVDA Flash Crashed! Will $90 Hold or More Blood Ahead?The market took a violent turn after Trump’s tariff bombshell, and high-flyers like NVDA are now in a fragile freefall. Is this a dead-cat bounce or a rare buying opportunity?
📉 Technical Breakdown (1H Smart Money Concepts)
* Bearish structure confirmed via BOS at $103 and $95.
* Trading inside a well-defined downward channel—respecting trendlines.
* Currently in a consolidation box near $92, inside potential demand.
🔑 Key Levels:
* Support: $90 (must hold) → below that, $87 and $85.
* Resistance: $95.60 (highest negative NETGEX), then $102–$104 (gap fill).
* MACD & Stoch RSI showing early signs of reversal—but no confirmation yet.
🧲 Options Sentiment via GEX (1H)
* Highest Negative NETGEX at $95.60 → massive short interest.
* PUT Wall: $90 (crucial support), next level at $85.
* CALL Wall: $108–$110 = strong rejection zone this week.
* Options Oscillator:
* IVR: 65.2 | IVx avg: 92.9 → volatility priced in.
* Calls%: Only 8.7% bullish participation → extremely bearish positioning.
* GEX color: 🔴🔴🔵 = bearish zone, but potential for volatility-based reversal.
🧠 Scenarios to Watch
🔻 Bearish Trade Setup:
* Short rejection from $95–$96
* Target: $90 → $87
* Stop: $98
🔼 Bullish Scalp Idea:
* Long on confirmed reclaim of $95.60
* Target: $102–$104 (gap-fill)
* Stop: $92.50
🧳 Investor Perspective
We’re entering accumulation zones. Start building long positions below $90 in steps. Major long-term support lies between $85 and $80. Use time-based entries, not emotion.
📌 NVDA Takeaway:
* Market sentiment is fear-driven, but AI fundamentals are still intact.
* $95 = battlefield. $90 = line in the sand.
* Stay nimble. Be patient. Watch volume and flow.
🔔 Follow for daily TA with SMC + GEX setups
💬 Drop a comment: Bullish or Bearish NVDA this week?
❗Disclaimer:
This is not financial advice. This post is for educational purposes only. Do your own research and manage your risk.
🧵 Hashtags:
#NVDA #NVIDIA #OptionsFlow #GammaExposure #TechnicalAnalysis #SmartMoneyConcepts #GEX #TradingView #StockMarketCrash #TariffNews #InvestorMindset #BearMarketBounce
Head & Shoulders Pattern + 0.786 Fib + Gap WIndowThe measured move off the Head & Shoulders pattern presents a measured move target of $73 if price continues to fall on NVDA. The 0.786 Fib 0.786 retrace had a perfect touch on Friday. Expect a 11% bounce from the 0.786 to the gap fill above. Retrace target = 0.618 Fib. This would establish another Lower High. Trend still presents with downward momentum. Then, expect the next move down towards $75.04

NVIDIA short then longI still think NVIDIA has about 10% downside to go, then enjoy a nice long ride up. Hope the chart makes sense. Have a great day!!


Cryptocurrency and Stocks will DecoupleI still remember the AI saying that NVDA was going to 320 "in the near future." This was back in June 2024. No matter when you asked the AI, its only prediction would be up, it couldn't make an analysis based on the data coming from the chart. The program wasn't very intelligent, that's what I concluded.
I disagreed. NVDA is going down and this is now fully confirmed.
We are seeing a very long distribution phase and the crash is now taking place.
Ok, but what about Bitcoin?
Bitcoin will decouple from traditional markets, just look at the news.
While Cryptocurrency is due a generational bullish wave, the stock market is due a generational retrace.
I honestly don't know how the stock market will perform but I can look at individual charts. NVDA is bearish and going down strong.
NVDA, TSLA, the SPX, the NDX and Crypto are not the same. These are two completely different monsters.
The SPX and NDX is landline.
Crypto is free wireless internet for all.
The SPX and the NDX is centralization and control.
Bitcoin is decentralization, innovation, technology and freedom.
Times change.
The stock market will recover and it is sure to continue growing long-term.
Will the establishment let it crash or will they jump in and pump it up?
I don't know. But NVDA is bearish and going down. What one does, the rest follows.
But, what about Bitcoin? Bitcoin is going up.
It is very simple. They will decouple, they will not move together anymore. Many, many Altcoins are trading at bottom prices, many stocks are trading high up.
The giant stocks will crash, while the Cryptocurrency market goes up. This is one more of the reasons why we are about to experience the biggest bull-market in the history of Crypto.
People are evolving, the world is changing. We are changing from centralized monopoly money, to a free decentralized technology that is available for all.
Money is not the paper, the shiny stone or the codes; money is what we decide to use for the purpose of exchanging value.
At one time, salt used to be money as well as cows. Sea shells, glass and cacao are also on the list. People used to use these things as money.
The argument that Bitcoin has no value is obviously flawed. If you want to buy a Bitcoin you have to pay a price, that's value, nothing more.
If we decide to use something as money, it becomes money.
Bitcoin is money for the new generation.
The old generation dies out and a new one takes its place.
Life will continue to evolve and money will do the same.
Now it is Bitcoin, later down the road it will be something else. But Bitcoin has value, it is really expensive and it will continue to grow.
After the crash, NVDA will recover for sure.
Namaste.

Next term.In my opinion, the uptrend was already over before the trade wars started.
* The purpose of my graphic drawings is purely educational.
* What i write here is not an investment advice. Please do your own research before investing in any asset.
* Never take my personal opinions as investment advice, you may lose your money.

NVDA’s Final Act: A Breakout Waiting to HappenNVDA appears to be nearing the completion of its corrective phase, setting the stage for a potential move to new highs. The current pattern resembles a falling wedge, indicative of an ending diagonal formation, which often signals a reversal and the start of an upward trend.
The structure of the corrective channel, along with the termination of the diagonal pattern, suggests a high likelihood of a running flat formation. Buyers are likely to intensify demand pressure as the price approaches the lower boundary of the trendline. A trend reversal may occur if there is a decisive breakout above the Wave 4 level of the ending diagonal.
Buying opportunity with minimal stop is possible after the reversal from lower side of the channel. Targets can be 112 - 120 - 132 - 140.
I'll be sharing more details shortly.

$NVIDIA ─ Wyckoff Distribution #4 aka Rising Wedge PatternVANTAGE:NVIDIA ─ Wyckoff Distribution #4 aka Rising Wedge Pattern
Although Rising wedge turning into more like Rising Channel distribution idea is still valid.
#2 Long Trade TP1 Hit so far 🔥
------------
------------
Note: This is the most positive outcome possible.
As always, my play is:
✅ 50% out at TP1
✅ Move SL to entry
✅ Pre-set the rest of the position across remaining TPs
It's important to take profits along the way and not turn a winning trade into a losing trade.

Nvidia monthly chartAt highest pick I seen a mid or long term decrease. very high p/e and pomped prices didn't keep trend 📈 upward

Short $NVDA until ~NovemberI've had that chart drawn out for a while. Since 2018, we've had an interesting cyclical pattern of 60% drawdowns for 9-11 months every 38 months.
I'm short until ~November and/or until we reach ~$50-60. At that point, I'll turn bullish again and go long.

NVDA Major Trend BreakNVDA finally broke down below its major uptrend it has been in since February 2024. It did move below briefly recently during the DeepSeek sell off, but quickly reclaimed. This time it has fallen much farther below so I'd say it's a bit more concerning for bulls. It did bounce and hold right around that low it made the last time it broke, but this looks like a stronger break that has a better chance of staying below.
This is mission critical for the broader market and if it can't reclaim quickly, it is likely a signal of a longer term correction for the stock itself and the entire market. It will be very important to watch moving forward. First downside targets are 97.40 (previous double top and ATH) and 90.69 (August 2024 low).

Oct 2023 Anchored VwapNvdia was the only stock that i could find that did not touch the Oct 2023 anchored vwap. I think before the market sees a turnaround, Nvdia should touch the vwap at about $95 before it reverses. But we all know, anything can happen.

