NXPI - Fib Circle RetestA retest of the circle 1.618 fib circle in blue
This has been seen as an area of support for awhile now
I say price will fall to it and find support again before price takes off back upwards on this daily chart
A double top is also present that supports the idea that a downward movement is coming on this daily
NXPI trade ideas
Nxpi in the next few daysNxpi will be bullish in the next few days
we will see very strong movement in the next few days for this stock

NXPI at a Crucial Support: A 60% Upside Potential?📉 Current Price: $210
📊 Technical Outlook:
NXPI is testing a strong trendline support. The stock is currently hovering around the 200-Week Moving Average, which has acted as a dynamic support level in past corrections.
Additionally, it is at the 61.8% Fibonacci retracement level from the previous high, a crucial level often associated with reversals.
The MACD indicator is in oversold territory, signaling a potential trend reversal.
🔮 Bullish Scenario:
If this support holds, we could see a bounce towards $340, aligning with the upper trend channel resistance and previous highs.
This move would represent an impressive 60% upside from the current levels.
🚨 Risk Management:
A breakdown below $195 (trendline & 61.8% Fib failure) could invalidate this setup, leading to further downside toward $167 (78.6% Fib level).
💡 Final Thought:
NXPI is at a decision point. A strong rebound could offer a great risk-reward opportunity for long-term investors. 📈
Do you think NXPI will hold this support and rally? Comment below! 🔥

NASDAQ-NXPI: Is the Market on the Verge of a Reversal?A Critical Juncture: What’s Next for NASDAQ-NXPI?
The semiconductor sector has been riding a wave of volatility, and NASDAQ-NXPI is no exception. The stock currently trades at $208.55, reflecting a 29.56% decline from its all-time high of $296.08 recorded in mid-2024. With a downward deviation of nearly 30%, the market is now questioning whether this is a buying opportunity or the precursor to another leg down.
Technicals reveal a battle between bulls and bears. The 50-day moving average sits at $212.72, hovering just above the current price, indicating a near-term resistance zone. Meanwhile, RSI (Relative Strength Index) at 39.35 suggests the stock is creeping into oversold territory, yet not signaling a definitive reversal. Furthermore, sell volumes have surged, forming multiple bearish candle patterns, reinforcing the short-term downside risk.
Adding to the complexity, macroeconomic pressures, including a strong U.S. dollar and shifting interest rate expectations, have kept buyers cautious. But with powerful support levels at $206.34 and $198.82, is this a crucial inflection point?
The Big Question: Reversal or Continuation?
With a resistance ceiling at $211.02, the next move could define NXPI’s short-term fate. A break above this level could trigger a bullish surge, but failure to hold above $206.34 may invite another wave of selling.
Will buyers step in at this critical moment, or are we in for another leg downward? The answer may shape the next major move in NXPI. Stay alert.
NASDAQ-NXPI Roadmap: Tracking the Market’s Footsteps
January 14 – Buy Volumes Max (Confirmed Bullish Signal)
The first major signal of a buy-side push emerged on January 14, with an increased buy volume pattern at $208.88. The price closed higher at $210.53, setting the stage for a continuation. The key takeaway? Buyers were stepping in, and the momentum was shifting.
January 15 – Sell Volumes Max (Bearish Reversal Signal Fails)
Just a day later, sell-side pressure increased, marking a potential reversal with a closing price of $213.49. However, instead of following through, the market did not sustain the downward movement, negating this sell signal. The previous buy volume pattern held firm, proving bulls were still in control.
January 17 – VSA Buy Pattern 3 (Confirmed Bullish Trend)
The market locked in another bullish confirmation as the VSA manipulation buy pattern formed at $214.45, closing higher at $214.61. With strong buying activity in place, the stock continued its ascent, respecting the trendline and validating the prior bullish signals.
January 21 – Sell Volumes Max (Bearish Confirmation)
The first true bearish confirmation materialized as the price turned south, closing at $214.78 after opening at $215.26. This drop signaled a shift in sentiment and tested the conviction of the bulls. With further confirmation needed, all eyes turned to the next move.
January 22 – Sell Volumes (Bearish Momentum Builds)
With a lower close at $215.98, sellers began solidifying control. The sequence of declining closes and increased sell volumes confirmed the downtrend was gaining steam.
January 23 – Buy Volumes Take Over (Reversal in Motion)
Just as the bears looked ready to dominate, buyers stepped back in, driving the close to $219.89. This strong shift nullified the previous bearish sequence and set the stage for a fresh upward move.
January 24 – Buy Volumes Max (Confirmed Bullish)
Momentum followed through with a close at $213.44, reinforcing that buying interest was sustained. The roadmap now pointed to another attempt to test higher resistance levels.
January 27 – Increased Buy Volumes (Final Bullish Confirmation)
The price surged to $215.2, cementing the overall bullish bias established throughout the roadmap. The earlier bearish dips proved to be shakeouts, and those who stayed in line with the buy-side confirmations saw the real move unfold in their favor.
This roadmap clearly showcases how bullish and bearish patterns played out, giving traders and investors a structured way to read the market’s evolution. Will the next setup follow the same rhythm, or is a fresh shakeout coming? Stay alert.
Technical & Price Action Analysis
Support Levels:
206.34 – local buyer zone; if broken, expect further downside
198.82 – critical level for bulls; a break here could trigger a move to 192
192.375 – last potential hold for buyers; below this, free fall territory
Resistance Levels:
211.02 – immediate resistance; needs a solid breakout for upside continuation
222.00 – key level to watch; if bulls take control, momentum could accelerate
234.955 – major resistance; breakout here would shift the structure bullish
Powerful Support Levels:
224.26 – a strong demand zone; if lost, could flip into heavy resistance
Powerful Resistance Levels:
200.00 – psychological barrier; flipping above this would be a strong bullish sign
175.00 – long-term level; failure to reclaim may keep sellers in control
149.90 – structural pivot; reclaiming this zone would confirm trend reversal
If any of these levels fail to hold, they will act as new resistance zones, and the price will likely revisit them before making the next move. Watch for fakeouts and liquidity grabs before committing to a trade. 🚨
Trading Strategies Based on Rays
Concept of Rays
My proprietary analysis method is built on Fibonacci-based rays, dynamically adjusting to market movement. These rays create predictive zones where price interactions suggest either continuation or reversal. Importantly, entry positions are taken only after price interacts with a ray and initiates movement. Each move extends from one ray to the next, setting up structured trade targets.
Dynamic Factors in Play
Moving Averages: MA50 at $212.72, MA100 at $214.16, and MA200 at $212.76 serve as dynamic resistance/support levels. Their intersection with key rays amplifies probability zones.
VSA Rays: These pre-defined market structures align with volume-driven price shifts, making them highly reactive points for execution.
Optimistic Scenario (Bullish Continuation)
Entry: Break and close above $211.02 after ray interaction.
First Target: $222.00 – Key resistance; first profit zone.
Second Target: $234.955 – Breakout continuation level.
Third Target: $247.67 – Long-term bullish extension.
Pessimistic Scenario (Bearish Breakdown)
Entry: Rejection from $211.02 or breakdown below $206.34.
First Target: $198.82 – Major support test.
Second Target: $192.375 – Strong demand zone.
Third Target: $175.00 – Structural breakdown zone.
Trade Opportunities Based on Rays
Momentum Breakout Trade: Long on a break above $211.02, targeting $222.00.
Reversal Trade: Short after a rejection from $211.02, aiming for $206.34.
Pullback Entry: Buy from $206.34 if it holds as support, riding to $211.02.
Breakdown Trade: Short if $206.34 fails, targeting $198.82 first.
Range Scalping: Buying dips at $206.34, selling resistance at $211.02 until a breakout.
These setups provide both aggressive and conservative trading approaches. Every trade moves from ray to ray, setting up the next logical price step.
What’s Next? Let’s Discuss!
Trading is all about understanding key levels and making decisions at the right moment—that’s exactly what my ray-based strategy helps with. If this breakdown made sense to you, drop a comment with your thoughts or questions—I always reply!
Don’t forget to hit Boost and save this idea so you can check back later and see how price moves along my levels. Tracking the market in real-time is the best way to sharpen your trading edge!
By the way, all the rays and levels are automatically mapped by my private indicator. If you’re interested in using it, send me a direct message—I’ll explain how it works.
Looking for custom analysis on another asset? I can do that too! Some ideas I share publicly, others—privately on request. If there’s a ticker you want mapped out, Boost this post and let me know in the comments!
And if you find my insights valuable, make sure to follow me here on TradingView—this is where all my best work gets posted first. Let’s trade smart! 🚀

NXP Semiconductors (NXPI) | Chart & Forecast SummaryKey Indicators on Trade Set Up in General
1. Push Set Up
2. Range Set up
3. Break & Retest Set Up
Active Sessions on Relevant Range & Elemented Probabilities;
* Asian(Ranging) - London(Upwards) - NYC(Downwards)
* Weekend Crypto Session
# Trend | Time Frame Conductive | Weekly Time Frame
- General Trend
- Measurement on Session
* Support & Resistance
* Trade Area | Focus & Motion Ahead
# Position & Risk Reward | Daily Time Frame
- Measurement on Session
* Retracement | 0.5 & 0.618
* Extension | 0.786 & 1
Conclusion | Trade Plan Execution & Risk Management on Demand;
Overall Consensus | Buy

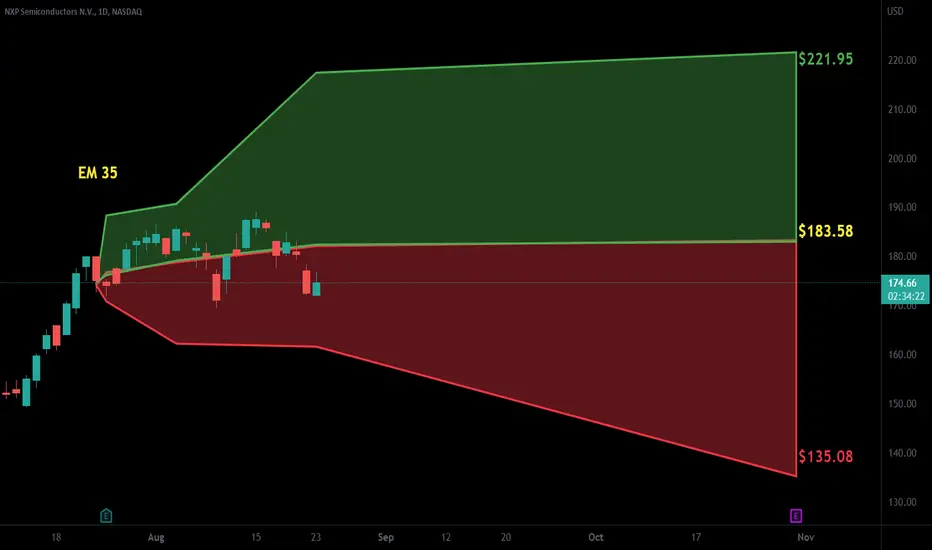
Time to Accumulate for the next run As you can see from the patterns in both MACD RSI and price chart. NXP went into another correction phase. It's just perfect times to accumulate and wait about 1 year or so to see another 40 to 50% from the bottom of the correction. I suggest to distribute the accumulation in time to get better average price closer to the bottom.
Disclaimer: This is not a financial investment advise, it is only my personal view. Take risk in your own terms.

NXPI will roar!Looking at the technical indicators and strong revenue predictions; NXPI first should try 250 range and then probably go down to ~211 (+/- 10) price levels to gain strength to test 250 again and 280 region for the first time in the next coming months until the end of 2023-Q4.

NXPI NXP Semiconductors Options Ahead of EarningsAnalyzing the options chain and the chart patterns of NXPI NXP Semiconductors prior to the earnings report this week,
I would consider purchasing the 300usd strike price Calls with
an expiration date of 2024-10-18,
for a premium of approximately $9.10.
If these options prove to be profitable prior to the earnings release, I would sell at least half of them.
NXPI NXP Semiconductors

NXPI: Potential BuyCurrently retesting the previous range, I'm seeing upside potential backed by positive analyst expectations.

NXP Semiconductors May Be Starting to MoveChips have begun 2024 on a strong note, and some traders may look for NXP Semiconductors to participate in the rally.
The first pattern on today’s chart is October’s monthly closing high of $203.46. NXPI paused below the level around November 20. It then climbed, and the same price area went from being a weekly high to a weekly low. A successful retest followed on January 17. Has old resistance become new support?
Second, the shares have moved higher along their rising 50-day simple moving average (SMA). The 50-day SMA also crossed above the 100-day SMA in mid-December. That may suggest the intermediate- and long-term trends are getting more bullish.
Third, NXPI’s latest pullback represented a 50 percent retracement of its most recent bounce. Holding that retracement may suggest the short-term trend is getting bullish as well.
TradeStation has, for decades, advanced the trading industry, providing access to stocks, options and futures. See our Overview for more.
Important Information
Past performance, whether actual or indicated by historical tests of strategies, is no guarantee of future performance or success. There is a possibility that you may sustain a loss equal to or greater than your entire investment regardless of which asset class you trade (equities, options, futures or cryptocurrencies); therefore, you should not invest or risk money that you cannot afford to lose. Online trading is not suitable for all investors. View the document titled Characteristics and Risks of Standardized Options at www.TradeStation.com . Before trading any asset class, customers must read the relevant risk disclosure statements on www.TradeStation.com . System access and trade placement and execution may be delayed or fail due to market volatility and volume, quote delays, system and software errors, Internet traffic, outages and other factors.
Securities and futures trading is offered to self-directed customers by TradeStation Securities, Inc., a broker-dealer registered with the Securities and Exchange Commission (“SEC”) and a futures commission merchant licensed with the Commodity Futures Trading Commission (“CFTC”). TradeStation Securities is a member of the Financial Industry Regulatory Authority, the National Futures Association (“NFA”), and a number of exchanges. TradeStation Crypto, Inc. offers to self-directed investors and traders cryptocurrency brokerage services under federal and state money services business/money-transmitter and similar registrations and licenses.
TradeStation Securities, Inc., TradeStation Crypto, Inc., and TradeStation Technologies, Inc. are each wholly owned subsidiaries of TradeStation Group, Inc., all operating, and providing products and services, under the TradeStation brand and trademark. TradeStation Crypto, Inc. offers to self-directed investors and traders cryptocurrency brokerage services. It is neither licensed with the SEC or the CFTC nor is it a member of NFA. When applying for, or purchasing, accounts, subscriptions, products and services, it is important that you know which company you will be dealing with. Visit www.TradeStation.com for further important information explaining what this means.

NXPI: Potential BuyI'm expecting the bullish momentum to continue towards new all time highs. Areas plotted to look out for.

Breaking New Heights: C&H Formation Unleashes Bullish Surge!Breaking New Heights: C&H Formation Unleashes Bullish Surge!
NXP Semiconductors
Chart Analysis
1.Price Formation: The price has broken out from a C&H price formation on a daily chart.
2.Moving Averages: The 7-day moving average (MA) is above the 21-day MA, which is a positive sign indicating bullish momentum.
3.200-day Moving Average is below the Price.
4.Thus, Mas 7>21>200
5.Relative Strength Index (RSI): The RSI is > than 50, indicating bullish momentum and potential further upward movement.
6.Price Target: $320
The Company NXP Semiconductors
NXP Semiconductors, a global semiconductor company founded in 2006 and headquartered in Eindhoven, the Netherlands, specializes in mixed-signal solutions for various sectors, including automotive, industrial and IoT, mobile, and communication infrastructure. As of the third quarter of 2023, the company reported a total revenue of $3.4 billion, a gross profit of $2.0 billion, and a net income of $792 million. NXP is listed on the NASDAQ stock exchange under the ticker symbol NXPI, with a stock price of $232.7 as of December 14, 2023, contributing to a market capitalization of $57.1 billion. The company's enterprise value was estimated at $64.2 billion.
Kurt Sievers serves as the CEO, and the company employs approximately 34,500 full-time employees across more than 30 countries. Key facilities are located in the United States, the Netherlands, Singapore, Thailand, Taiwan, Malaysia, and China. Its product portfolio includes micro controllers, application processors, communication processors, wireless connectivity solutions, analog and interface devices, radio frequency power amplifiers, security controllers, and semiconductor-based environmental and inertial sensors.
NXP's competitors include Infineon, Qualcomm, Texas Instruments, STMicroelectronics, Skyworks Solutions, and Renesas Electronics. The company's dividend information as of 2023 indicates an annual dividend of $4.06 per share with a forward yield of 1.74%, paid quarterly.

#NXPL#NXP Semiconductors N.V. (NASDAQ:NXPI) has been the subject of a variety of analyst ratings reflecting different sentiments. As of October 24, 2023, one rating agency was bullish and another slightly bullish, indicating a generally positive outlook for the company's stock, albeit with some reservations. Another source has a consensus rating of "Buy" and a consensus target price of $227.37, indicating a potential upside of +16.90% for the stock. However, Susquehanna and Morgan Stanley have recently made some adjustments to the price target, which may need to be taken into account.
The stock closed at $182.35 per share on October 23, 2023 and has gained 22.60% despite a return of -6.48% over the past month.
On the financial front, NXP Semiconductors had a strong year in 2023. in the second quarter of 2023, the company achieved revenues of $3.3 billion, hitting the upper end of its guidance, with better-than-expected performances across all of its key end-markets.4 Similarly, in the first quarter of 2023, the company reported revenues of $3.12 billion, which also exceeded the upper end of its guidance.5 The company has also reported revenues of $3.12 billion, exceeding the upper end of its guidance.
From a technical perspective, the Ichimoku meter below the short-term support in the vicinity of $176, RSI and MACD indicator performance is still still presenting a short trend, focusing on the price near 165, if the short-term fall below the support zone is to consider a batch of position reductions. If the follow-up price continues to fall but in the price support and effective rebound to 171 can continue to hold above is expected to break through to a new high of 229 dollars!

NXPI longone of the more overlooked semi names. shorter term play, monthly contracts or at least a week or two of time. filled one gap, looking to fill the other near just short of ATH.
watch that swing POC and previous value as support (210-212), bears want to get below and reject to get some emas crossing.
EMAs defended as price checks daily trigger, price crossing above hourly emas and testing earning aVWAP again. Looking to buy strength above earnings aVWAP or a tag of hourly trigger.
as long as the hourlies (purple, violet) dont cross the daily (yellow) i will remain bullish.
really needs to get above this earning aVWAP, though.
shorter timeframe traders looking to cross those hourlies back upward and buy a check of one of them.
clear risk at that 210/212 demand for high timeframe traders. short timeframers, i'd say just watch the hourly emas. maybe 217?

NXPI WeeklySolid semi out of the Netherlands. Finbox models have a 25% upside, and that is green point D on the ABCD. The green ABCD is cloned off the red ABCD.
I would definitely add some at green point C or the Red dashed line. But a solid break and hold below green C would be a trend reversal. I don't see that happening with the good volume support.

Watch for NXPI breaking out of a big base.NXPI is a semiconductor devices stock that has the potential to break out from a February 2022 into June 2023 big base pattern. A decisive push above 197-198 would confirm this bullish setup and suggest upside back to the late 2021 peaks near 228-229 and 239-240 and then toward the pattern count at 260-263.
Until then, NXPI has support from 186 (chart level) to 176-161 (rising 13, 26, 40 and 200-week MAs). NXPI has improved on a rally above its weekly MAs relative to the SPX. Breaking out above the early 2021 downtrend line would help confirm the bullish absolute price pattern highlighted above. The last breakout above a relative downtrend resistance provided a bullish signal for NXPI in late 2020.
NXPI has the potential to break out from a February 2022 into June 2023 big base pattern. A decisive push above 197-198 would confirm this bullish setup and suggest upside back to the late 2021 peaks near 228-229 and 239-240 and then toward the pattern count at 260-263. Until then, NXPI has support from 186 (chart level) to 176-161 (rising 13, 26, 40 and 200-week MAs)

NXPI Semiconductors: Bullish ABCD BAMM ProjectionNXPI is trading within a weekly consolidation structure that appears to be bottoming out and preparing to make at least an 0.886 retrace, and recently it has formed a Bull Flag and it has also confirmed Hidden Bullish Divergence on the Monthly with a MACD Bullish crossing.
Out of all the big chip suppliers, NXPI is one that has yet to make any crazy moves up and is still trading within a value area, but that likely wont last long as it catches up with the rest of the sector as it is an active supplier within the sector.

Buy signal in NXP
NXP semiconductor is moving up slowly , and around the bottom of current swing. IF market stays positive for few days, it can give 3-5% on the upside.

$NXPI with a bullish outlook following its earnings #Stocks The PEAD projected a bullish outlook for $NXPI after a positive under reaction following its earnings release placing the stock in drift A with an expected accuracy of 100%.
Fasten your seatbelts⚡Seems like the bullish breakout is finally here. The chart speaks for itself - if I should elaborate on something feel free to use the comment section here ....

With a little help from the FED!-Things need to straighten out for economies to prosper, and that's the motto the Fed is currently chasing.
-For the FED to be able to straighten things out, it first needs to control inflation, which at the moment is not just American, it is global.
-With the rise in prices of various commodities (oil, proteins, chips and ores), it becomes increasingly difficult to keep a country's economy on track, the most appropriate solution for this type of situation is to increase interest rates central banks far away, which controls consumption and induces economies into a controlled coma (disinvestment).
-But to what extent are central banks able to control the "induced" coma without hindering growth? That's the billion dollar question that needs to be answered.
For the NXPI asset, the long average supported prices, despite the FED having given that little help by increasing the basic interest rate, which contributes to the contraction of the global economy.
-At the moment, the asset has formed a bearish pivot that could have destinations at: $154.69 and 150.27 as the first stage. The other stages in case there is such a “recession”, are: $131.54 and $112.81.
--If prices lose the $160.00 range, the above planned declines could start.
-Do your analysis and good business.
-Be Aware, If You Buy, Use Stop!

Many Megatrends Depend on Semiconductors. Governments are competing with each other to ensure stable future supplies
The phrase ‘chip shortage’ has made quite an impression1.
- The US has earmarked an enormous one-time sum, $77 billion, in subsidies and tax credits to boost chip production within the US
- China is prepared to spend more than $150 billion through 2030
- South Korea is poised to offer an array of incentives over the coming five years, valued at roughly $260 billion
- The European Union (EU) is seeking to spend $40 billion
- Japan is seeking to spend $6 billion
In 2021, revenues in semiconductors were $553 billion, and are expected to grow to $1.35 trillion by 2030. Roughly three-quarters of chip-making capacity is in China, Taiwan, South Korea and Japan. The US only sits at about 13%, whereas the EU sits at roughly 9%2.
All chips are not the same
The Covid-19 Pandemic has shown different economies the importance of securing the supply of semiconductors. One thing to note is that there is a wide variety of semiconductors, and some countries are seeking to secure one type of supply over another. China’s push is aimed less at the cutting edge and more at being a higher volume player in the essential part of the market for lower priced but still important chips3. Some necessary chips that inhibit the production of automobiles, for example, could be valued at $1 dollar or less on a per-unit basis4, far from the most cutting edge in the space.
Company results are showcasing both successes and failures
Intel reported that Q2 earnings that received a bleak reception, with revenue falling 17% relative to Q1 of 2022. This was the worst sequential quarter-to-quarter revenue performance going back to the year 2000. Intel also noted a delay to its next generation server chip, Sapphire Rapids, and that its data centre chip business would grow slower than the overall data centre market for two years5. This compares to Taiwan Semiconductor Manufacturing Company (TSMC) growing revenue 37% and profit by 76% year-over-year6.
Earlier in 2022, Samsung reportedly lost its two biggest foundry customers, Qualcomm and Nvidia, to TSMC. Reports indicate that they were not satisfied with Samsung’s capability in the 4 and 5-nanometre space, which represents the current cutting-edge in semiconductor manufacturing. TSMC captures greater than 50% of foundry market share, operating at a market share level roughly three times that of Samsung. Still, Samsung did hold a recent ceremony to celebrate its first shipment of 3-nanometre chips, hitting this milestone faster than TSMC7. In contrast, it is estimated that roughly 25% of TSMC’s business is from Apple, and then Nvidia, Qualcomm and Advanced Micro Devices (AMD) are estimated to provide about another 5% each8.
Capital expenditures set companies up for future growth
TSMC is also investing at an incredible clip, aiming to spend up to $44 billion in 2022 compared to Samsung’s $12 billion, even if Samsung has announced a spending plan to total $151 billion between now and 20309. Intel has announced in its most recent, admittedly tough, quarterly results a plan to cut planned capital expenditures in 2022 by 15% to a level of $23 billion10.
Samsung is also facing competition in the dynamic random access memory (DRAM) business, as Micron and SK Hynix have introduced some of the most advanced chips for these purposes. Still, even amidst the competitive onslaught, Samsung’s DRAM market shares sit at about 40%. In the smartphone application processor market, Samsung’s market share was 6.6%, compared with Qualcomm at 37.7%, MediaTek at 26.3% and Apple at 26%11.
Time to invest?
Semiconductor companies tend to follow a particular rhythm, seeing strong demand, making investments, increasing supply, hitting levels of oversupply in certain types of chips, then waiting for the market to re-attain something closer to equilibrium. Today, we may be at the tail-end of the ‘chip shortage’ and it may not, at least in the short run, be the time to expect an immediate performance pop in the share prices of most semiconductor companies.
However, any megatrend that touches technology in any way requires semiconductors to function—in a sense if any of them grow, the demand for necessary semiconductors will also grow. Having a multi-year time horizon could be of greater interest, in our view. Since not all semiconductors are the same, it is also worth recognising that different companies may be more associated with different megatrends—for instance, certain companies are doing more in Artificial Intelligence (AI) model training space, whereas others are doing more in the industrial and automobile space. The supply/demand balance within different types of semiconductors will not necessarily be the same.
Sources
1 Source: Sohn, Jiyoung. “The U.S. Is Investing Big in Chips. So Is the Rest of the World.” Wall Street Journal. 31 July 2022.
2 Source: Sohn, 31 July 2022.
3 Source: Strumpf, Dan & Liza Lin. “China Bets Big on Basic Chips in Self-Sufficiency Push.” Wall Street Journal. 24 July 2022.
4 Source: Gallagher, Dan. “No Quick Fix for Auto Chip Shortage.” Wall Street Journal. 9 February 2021.
5 Source: Kim, Tae. “Intel Stock Will Plunge Further, Analyst Says, after ‘Worst’ Quarter He Has Ever Seen.” Barron’s. 29 July 2022.
6 Mellow, Craig. “Taiwan Semi’s Spending Spree Will Pay Off Big in the Long Term.” Barron’s. 29 July 2022.
7 Source: Jung-a, Song & Christian Davies. “Samsung seeks to reassure markets over semiconductor competitiveness.” Financial Times. 30 July 2022.
8 Source: Craig, 29 July 2022.
9 Source: Jung-a, 30 July 2022.
10 Source: Gallagher, Dan. “Intel Shows Limits of Chips Act.” Wall Street Journal. 29 July 2022.
11 Source: Jung-a, 30 July 2022.
This material is prepared by WisdomTree and its affiliates and is not intended to be relied upon as a forecast, research or investment advice, and is not a recommendation, offer or solicitation to buy or sell any securities or to adopt any investment strategy. The opinions expressed are as of the date of production and may change as subsequent conditions vary. The information and opinions contained in this material are derived from proprietary and non-proprietary sources. As such, no warranty of accuracy or reliability is given and no responsibility arising in any other way for errors and omissions (including responsibility to any person by reason of negligence) is accepted by WisdomTree, nor any affiliate, nor any of their officers, employees or agents. Reliance upon information in this material is at the sole discretion of the reader. Past performance is not a reliable indicator of future performance.

$NXPI with a Bullish outlook following its earnings #Stocks The PEAD projected a Bullish outlook for $NXPI after a Positive over reaction following its earnings release placing the stock in drift B with an expected accuracy of 69.23%.