NXPI1.272 AB=CD as price hits emotional level of $100. That exhuastion gap to the left s a good sign NXPI is overvalued around that $100 mark :)
NXPI trade ideas


inverse H&SIs this some kinda inverse H&S or just wishful thinking? It did break the downtrend line and hitting resistance at 85. curious what y'all think.

Breakout of the downtrendNice consolidation for 14 sessions and breakout of downtrend line/200SMA. I own shares and will have sell order ready 90-93 range.

NXPI breakout of channelNXPI has been in a descending channel since mid May, and finally confirmed a breakout. I would technically buy on the retest of the trendline, but the long term ascending trendline seems to be holding prices, so I'm looking to buy on a pullback to the 78.28 support level to go long. First target would be 87.69, but if price breaks through then I would be looking to target resistance at the 95 level.

NXPI 91.45 – Probes key resistance clusters on the daily chartNXPI 91.45 –bullish – Probes key resistance clusters on the daily chart
NXPI is probing key resistance clusters on the daily chart including the 200 day moving average currently at 92.09, the 3.5-month falling trendline (from June 1, 2015 peak) and the 50% retracement of the 114.00/72.05 fall at 93.12. A decisive upside breach of the area would extend the 4-week rally towards 94.90 (September 9, 2015 high) next. 89.13 (September 16, 2015 low) near the rising channel support should hold dips.
Outlook:
Daily: bullish
Weekly: bullish

NXPI 91.45 –bullish –Long-term trendline underpins strength NXPI 91.45 –bullish –Long-term trendline underpins strength
NXPI found support at 72.05 (August 24, 2015 weekly low) just above the 2.5-year rising trendline (from April 22, 2013 low). Since then, it has rallied strongly to retrace over 50% of the 114.00/72.05 fall. Technical indicators are improving, suggesting further upside. Above 94.90 (September 9, 2015 weekly high) would strengthen towards 110.26 (July 27, 2015 weekly lower high). However, a deeper pullback below a 3-week rising channel support would caution bulls for prolonged consolidation and expose the 85.13/81.32 zone (September 7/August 31, 2015 weekly lows) which may hold dips.
Outlook:
Daily: bullish
Weekly: bullish


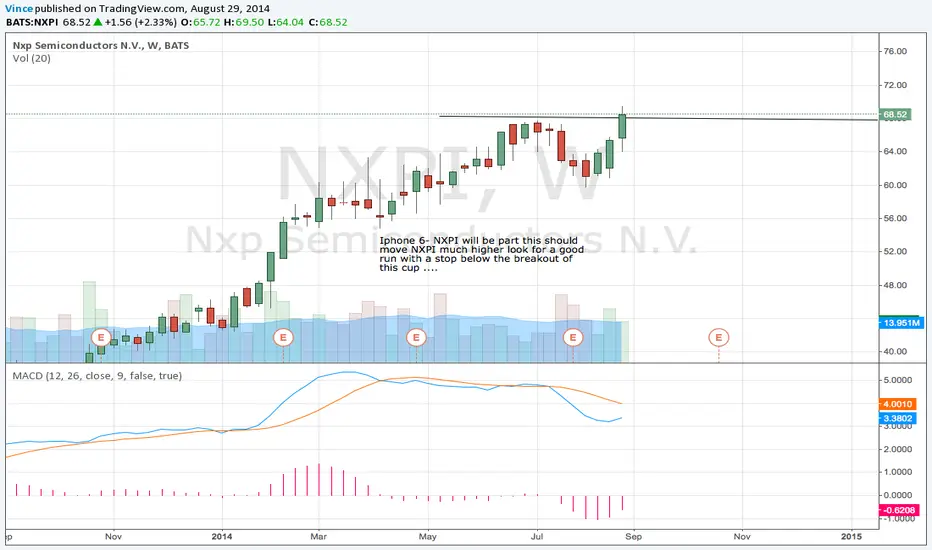
NXPI running on iPhone 6Watch for gap up on Monday this stock has great potential to run hard...I talked about it in London in 2012 and has come a long way since, the time is now


NXPIA good example why we don't short the PRZ. We wait for a topping formation of some kind. NXPI did not offer once and went right through the top of the PRZ.


