Long PYPLFollow up to
Nice entry now.
Entering 123 - 124.
Stop 118
Target 149.
Also selling various put spreads against strikes 120 and under.
PYPL trade ideas

Paypal Analysis 07.02.2022Hello Traders,
welcome to this free and educational analysis.
I am going to explain where I think this asset is going to go over the next few days and weeks and where I would look for trading opportunities.
If you have any questions or suggestions which asset I should analyse tomorrow, please leave a comment below.
I will personally reply to every single comment!
If you enjoyed this analysis, I would definitely appreciate it, if you smash that like button and maybe consider following my channel.
Thank you for watching and I will see you tomorrow!

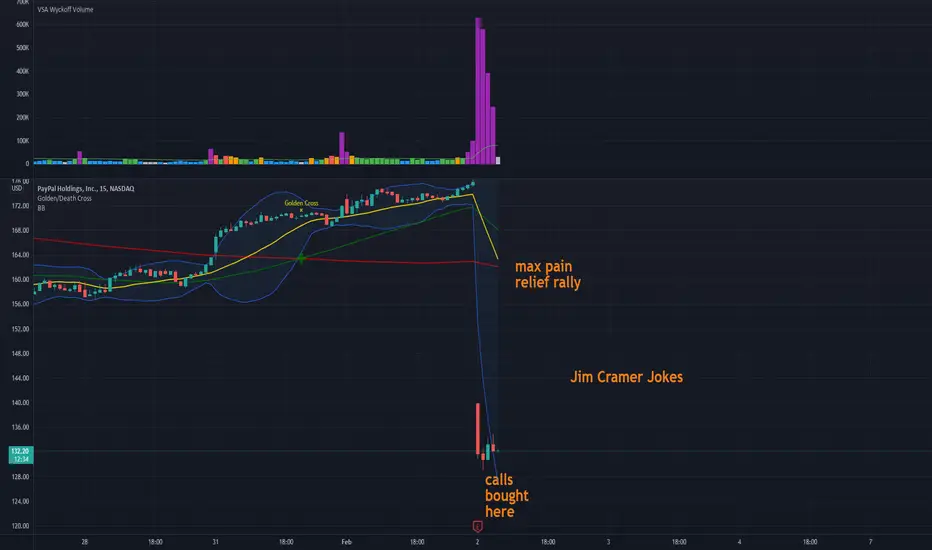
Hyper Short Time Frame Long PayPal for reverse rallythis has got out of control. at $130, the forward P/E was compressed down to sub 35
easy buy opp, follow the money: Grayscale, Cramer, Cathie Wood, Elon Musk, Peter Theil
How to Set EMA Crossover alerts in Trading ViewHow to set alerts for EMA crossovers on TV. This video is a tutorial on How to set an alert for the crossover of the 8 and 21 EMAs


PAYPAlPayPal shares have slumped over the past several days.
The company still has strong competitive advantages.
The shares look cheap at current levels.

PAYPAL HAS DONE 60% CORRECTION.. long is imminentThanks for coming around... your likes and comments means a whole lot to me......
This asset has rallied down from its all-time high of $310 zone down to its present low around $126 zone.
This bearish move corresponds to a 60% correction from the previous high. This current is also $4- $5 away from FIB 76.8.
For me, this asset may retrace and retest the current resistance zone.
My TP target for my long position will be the $150 - $156 zone.
#risk mnagaement #stop loss

PayPal - 58% Gains To ComeTwice Paypal tested the $309-310 region which was rejected with support around the $190-210 level (also the .382 fib retracement level), then at and around the $180 (also the .236 fib ret. level),
There is a larger descending wedge that had formed and the price has broken through the bottom trendline of the wedge and landed at the bottom of the fib retracement level subsequently a support line from previous trading activity.
I feel that this support line will be tested, held and price will extend back to the .236 Fib level, subsequently the bottom of the larger wedge. Providing a 33% Gain at the current level. This can be supported by the fact the stock is currently oversold.
Provided this holds and the resistance level is broken a surge to the top of the wedge will be tested again, subsequently, it also falls in line with the .382 fib level. This target will provide a 58% overall gain.
From here, pricing will bounce within the wedge to complete the pattern.
Could be a choppy but very lucrative opportunity to capitalise on a number of aligning patterns/indicators especially given its oversold territory.
Conversely, if the above is not true then we'll look for a drop to $100.
Upsize significantly outweighs downside in my opinion. 10% drop to potential 58% gain.
Love to hear your thoughts
N.B This is not investment advice and is my personal view and interpretation of the data with a view to provide my ideas and understanding of the patterns and tools for an open forum to have others provide their input and or knoweldge or alternative views to further enhance my understanding, interpretation and skills.


Fancy PayPal for a bounce nowUnfortunately it may happen as a gap up and I might have missed the action. Did not look at it until after the close. But we're currently holding a 161 of the recent failed rally and these often lead into ABC bounces.
Might just be a dead-cat, but I think we might see some bullish action in PYPL in the coming trading day or two.

PYPL - Oversold - PT: $160RSI indicator showing that PYPL is oversold on the 1H chart.
We see a bounce to $160 before making another small correction.
Long term price will recover to $220, this year.

PAYPAL - Discount too good to pass up on EarningI am Willing to take chances on Good Discounts. Anybody else take the Bait?

Day trade afternoon calls on 5m chart - 125 weekly supportSimple setup here with 30m extremely high directional selling and bullish divergence on 5/15 min. If markets calm into close then PYPL may rise. 125 is a possible bounce support on weekly chart. Call options are cheap and this will make a nice day trade if it works. Control risk, price may retest lows before bouncing.


PYPL share price to earnings comparisonSometimes in trading if you're doing what's obvious, you're on the wrong side of the trade the next week. lol. I'm dca PYPL after it's earnings drop. PYPL share price to earnings YTD comparison chart with old school and new Fintech companies:
PYPL:
P/E = 31.35
V
P/E = 39.83
MA
P/E = 45.42
AXP:
P/E = 18.45
DFS
P/E = 7.03
SQ
P/E = 107.18
AFRM
P/E = negative
SOFI
P/E = negative
Do your own due diligence, your risk is 100% your responsibility. This is for educational and entertainment purposes only. You win some or you learn some. Consider being charitable with some of your profit to help humankind. Good luck and happy trading friends...
*3x lucky 7s of trading*
7pt Trading compass:
Price action, entry/exit
Volume average/direction
Trend, patterns, momentum
Newsworthy current events
Revenue
Earnings
Balance sheet
7 Common mistakes:
+5% portfolio trades, capital risk management
Beware of analyst's motives
Emotions & Opinions
FOMO : bad timing, the market is ruthless, be shrewd
Lack of planning & discipline
Forgetting restraint
Obdurate repetitive errors, no adaptation
7 Important tools:
Trading View app!, Brokerage UI
Accurate indicators & settings
Wide screen monitor/s
Trading log (pencil & graph paper)
Big, organized desk
Reading books, playing chess
Sorted watch-list
Checkout my indicators:
Fibonacci VIP - volume
Fibonacci MA7 - price
pi RSI - trend momentum
TTC - trend channel
AlertiT - notification
tickerTracker - MFI Oscillator
www.tradingview.com

PaypalI dont see Paypal going lower then 120, we know everything can happen
i see Paypal turning to a digital bank in the future, and its getting ready for the big boom of crypto usage however we dont know when
the enrings were not bad and i am bullish on this company

Paypal Correction coming to an end ? Paypal has taken a beat down this week but when we zoom out its no more than a healthy correction .
Price began to correct after putting in a double top back in the summer and from then on we identify a change in market structure .
We are way down at the .786 Fib and heading towards .886 for around 110 a share .
Always wait and see the reaction of a level and look at volume and reactions on a LTF will give you some clarification.
If .886 is the last stop then you want to see a change in market structure on LTF with a higher low /Higher high but i
would expect a reaction at this level .
Fib speed fan and FIB Expansion used in chart + fixed Range

Paypal tech analysispotential bottom out as indicated in chart - closed big gap, 2nd upcoming in next few days/weeks.


PYPL is a share buy nowPYPL price to earnings is at a 6-year low. PYPL is a dca share buy or dca LEAPS call starting now imo. Otherwise give it the 3-day rule if you don't want to attempt to catch a falling knife yet. You may get a slightly better entry. Also, 2022 interest rate hikes could be positive for Venmo which is a Financial / Technology hybrid (Fintech). The company said in its earnings presentation it expects 2022 non-GAAP earnings of $4.60 to $4.75 per share on revenue of more than $29 billion.
Q4 December 2021 Consensus:
EPS = $1.12
Revenue = $6.9B
Q4 December 2021 Actual:
EPS = $1.11
Revenue = $6.9B
Fundamentals:
P/E = 31.85
EPS = $1.11
Revenue = $6.23B
Cash = $7.81B
D/A = .12
Div/Yld = ---
52 week high = $310.16
52 week low = $129.01
Do your own due diligence, your risk is 100% your responsibility. This is for educational and entertainment purposes only. You win some or you learn some. Consider being charitable with some of your profit to help humankind. Good luck and happy trading friends...
*3x lucky 7s of trading*
7pt Trading compass:
Price action, entry/exit
Volume average/direction
Trend, patterns, momentum
Newsworthy current events
Revenue
Earnings
Balance sheet
7 Common mistakes:
+5% portfolio trades, capital risk management
Beware of analyst's motives
Emotions & Opinions
FOMO : bad timing, the market is ruthless, be shrewd
Lack of planning & discipline
Forgetting restraint
Obdurate repetitive errors, no adaptation
7 Important tools:
Trading View app!, Brokerage UI
Accurate indicators & settings
Wide screen monitor/s
Trading log (pencil & graph paper)
Big, organized desk
Reading books, playing chess
Sorted watch-list
Checkout my indicators:
Fibonacci VIP - volume
Fibonacci MA7 - price
pi RSI - trend momentum
TTC - trend channel
AlertiT - notification
tickerTracker - MFI Oscillator
www.tradingview.com

PYPL Oversold!Fairly bold post considering today was PYPL's worst ever trading day but... I see a reversal in PYPL's downtrend incoming. The RSI is indicating that shares are far oversold on the weekly chart. As shown above it is approaching pretty solid support which could serve as an entry.
Just speculation...

Support @ 129Breakout 0 - very long term POC at 89
Breakout 1 - long term POC at 106 and 189
Breakout 2 - near term POC at 189
Peak 1 - POC at 189
Peak 2 - POC at 189
Support 1 - 129 - should hold, unless SPY goes into correction
Support 2 - 106 - will hold in case of SPY correction
Plan A:
Enter - Buy long term - at 129 if this breaks exit at 10% loss
Target - 189
Plan B: if 129 breaks
Enter 2 - Start buying long term at 106
Target1 - 129
Target2 - 189
