$RTX breakout #RaytheonGood momentum and breakout from Raytheon. First PT $95 with possible retest of box breakout. SL $89 zone.
Blue skies you gotta buy
RTX trade ideas

Cup&HandleCup&handle Pattern. I would sit on my hands until this breaks out of handle on clear conformation with with all standard sma's pointing up.

Defense Names Perking Up: Raytheon Technologies (RTX)Raytheon Technologies Corporation is an American multinational aerospace and defense conglomerate headquartered in Waltham, Massachusetts. It is one of the largest aerospace, intelligence services providers, and defense manufacturers in the world by revenue and market capitalization.
Buy: $89.41
Stop: $85.30
Target: Open
Also appearing on the scan this afternoon is Northrop Grumman.

Will the Airlines finally take off??GREETINGS!
I've made several posts on Rolls Royce and Raytheon the past few months. Ultimately, we remain bullish for another leg up, but the back-and-forth price action has been exhausting.
Why are we bullish? Well, my strategies involve a simplistic basis of eliot wave theory which shows airlines and major indices have another leg, but I also consider other non-voodoo indicators. For example, Look at the put/call ratio or general market sentiment... EVERYONE IS BEARISH . The contrarian should be salivating.
I'm here to provide an update on the RTX play. The primary count is still active, although price targets have changed slightly from the previous post (see related ideas below to see the DD).
Here I think we are compressing into a triangle wave 4 of C, resulting in a delayed takeoff. I have the 1.272 extension at $95, but we could go to the 1.618 near $105 which would also result in a sharp peak out of the channel, which we often look for for blow-off tops.
Triangles can be annoying to trade, depending on your time commitment available for your capital to be tied-up. This is because intermediate waves often consist of fakeouts! In this case, I think it's time to accumulate! I will be purchasing RYCEY and RTX (at these prices) as my primary exposure to the airline sector.
Good luck!

RTX EMA Pullback RejectionRTX has been rejected by the 13 EMA now twice over the past week. This looks like its heading lower to new support at the 83 level. It is also rounding down nicely


Oh dear... we might be at peak growth!'Where's your head at?'
If you've never watched Love Island - I have a girlfriend so I am practically forced to - this is a question that is asked by the contestants to their prospective partners to figure out the basic human relationship formation, as to whether someone actually likes them or not.
I like to use visual imagery to see whether it lines up with my feelings.
Are we currently on a lovely warm, Spanish island like the contestants...
Or are we in somewhere like Blackpool (think Gary, Indiana for those of you from the US)?
Let's see.
'Don't put all your eggs in one basket.'
I've seen a tonne of commentators talking about inflation as if it's going to be something like Weimar.
If you've been a subscriber for a while, you'll know that I think it's complete nonsense and we'll never have permanent inflation, or at least to the extent that said commentators reckon.
You literally just have to look at a long term chart of the US 10 year yield to note this.
If we were to have higher inflation, then nominals would likely be way higher.
They just aren't.
The key behind my argument here is that we have reached peak growth post pandemic and inflation can rarely maintain under such a poor labour market condition and lack of potential for wages to maintain their rise.
So let's check out the US Purchasing Managers' Index...
It's facing a bit of a decline.
No, I'm not a fan of using diffusion indices, but as a proxy for growth, especially after a time where the supply side was shot to pieces, we can argue that we are now looking at a slowing of manufacturing in the US.
My thoughts are that the cause of this rolling over is to do with China, 100%.
China has been a leader in providing credit to the world, and boosting global growth.
The past year or so, this relationship has remained constant - except they have gone the opposite way and have been deleveraging and reducing available credit.
We can pull up a chart to display not just US PMIs, but global PMIs to show the potential effects on growth that we are in for based off the Chinese credit impulse changes.
In my view, the market is acting far too insular by only focusing on the US economy internally, and not enough emphasis is being places on the spill over effects from China.
Again, the market is facing amnesia over history, and the relationship between credit, growth and globalisation, of which China has been a key driver of.
What's interesting about that chart is the lead time.
Ten months is rather a long time, but the implications of this could mean that we begin to see growth start to roll over in the next 3-6 months...
Now let's think of the implications here on the US...
'I'm being mugged off!'
Jackson Hole is just round the corner.
It's the one year anniversary of the Fed's new Average Inflation Targeting framework and the talk about town is whether the Fed will announce tapering or not.
With the 'proxy timeline' of peak growth being from now 'til the end of the year, they could be forced into a bit of a conundrum, especially if the next CPI print comes in soft as the prior one did.
See, they could be tapering into a growth scare - while the market is fully focused on tapering to control inflation (which I clearly think is redundant), tapering into peak growth is a magnitude worse.
Remember, central bank policy is largely psychological - it's about messaging, and market participants acting on that messaging.
Now think of growth and tapering as something that can only be done if both are moving the same way...
Taper into growth falling and the Fed is telling the market 'we don't necessarily want to support you', as well as all the other compounding factors that might have led to said growth falling.
People then shit themselves, since they're so used to the liquidity addiction of the past 12 years.
Not only this, but you might see a change in what businesses do.
Do they then start to put away capital since they think it's the end of the business cycle?
Take a look at this picture...
Where do you think we are now, based off of what has been said above?
I'd firmly say that we have moved from the 'risk on' phase to the 'caution' phase.
Below is a chart of NASDAQ futures with a rate of change indicator added.
What do we notice?
Well, more recently, rate of change in the tech index has slowed and has been rather compressed on a historical basis.
This is even while the US 10 year yield has faced downside pressures, something which you would have thought would provide a path of least resistance to the upside for big tech, since it discounts future cashflows - the rate of change relative to the 10 year yield has essentially been dampened.
For me, that signifies that other factors are at play...
The number one being the growth scare that this piece is about!
So, could the Fed be entering a policy decision that means they're going to mug themselves off?
I reckon so.
Perhaps it's not time to keep your (call) options open.
'My head has been turned'
Bank of America released their Global Fund Manager Survey yesterday...
Here's what they said if you want to buy into the peak growth story.
'For growth scare... 'long bonds vs stocks, long staples/utilities vs banks; for 'reflation resumption'... long EM & Japan.'
My thoughts are along the lines of this contrarian trade.
Take a peek at $TLT, the long bond ETF.
The fact that so many are still focused on inflation as being the mover of the long bond makes me excited.
The inflation story, in my view, is petering out as a driver, and growth will come back to the forefront.
Market chatter having a boner for inflation serves our idea well.
The US Conference Board has this to say on growth...
The Conference Board forecasts that US Real GDP growth will rise to 7.0 percent (annualized rate) in Q3 2021 and 6.0 percent (year-over-year) in 2021... Looking further ahead, we forecast economic growth of 4.0 percent (year-over-year) in 2022 and 3.0 percent (year-over-year) in 2023.
Do we think they're right?
I don't.
I think there will be misses on these estimates.
And the reason for that is the latest Michigan Consumer Sentiment Survey numbers...
Yeah, taper into that, ya nutters.
My thoughts are that stocks generally are less attractive with these matters considered.
What we should be looking at are more defensive plays, yes with the long bond, but also looking at the state of geopolitics now.
This is one reason why I am a fan of selling the Aussie vs Yen, but also versus GBP.
The Aussie dollar is a high beta currency, and selling it versus the yen plays into the peak growth story...
But selling it versus GBP negates the risk, since GBP is also high beta, and you're really playing a coronavirus & monetary policy differential theme there.
I would argue that looking at war stocks could be a good play too.
Here's Lockheed Martin coming into the 200WMA.
And Raytheon still hasn't breached its all time high from last March.
These are very much defensive plays on the market as a whole.
That's not to say to dump your NASDAQ exposure - that would be silly.
But I think the time is right to start looking a little more defensively, since there are far too many factors to make me think that simply holding through the next 6 months is optimum.
This market simply ain't my type on paper at the moment.

RTX LT IDEALT idea for a Biden Administration. Ultimately targeting over 100 and dip buys all the way down to 75 look good (If we get them).

$RTX with a Bullish outlook following its earnings #Stocks The PEAD projected a Bullish outlook for $RTX after a Positive over reaction following its earnings release placing the stock in drift B
If you would like to see the Drift for another stock please message us. Also click on the Like Button if this was useful and follow us or join us.

RTX - A PROXY FOR AIRLINES/AIRLINE INDUSTRY (RYCEY, AAL, BA)Airlines have had quite the run up since the low. Warren Buffet is way past his prime.
BUT WTF IS THIS PRICE ACTION!?
I've done a fair amount of "research" into the numbers here and here's my best attempt to make sense of it.
We all know the COVID correction was the E wave of a triangle. That was obvious. You see it on every major index.
Triangles happen in wave 4's... so now wtf is this "impulse??"
The 3-3-3-3-3 wave structure points towards some type of diagonal for the bullish count.
This sort of chop is going to wash people out if you don't have a game plan.
Here's mine.
It's always critical to pay attention to RSI or some other momentum indicator to spot corrections.
We know RSI rarely exceeds ~70 in corrections and rarely goes lower than ~30 in uptrends. We will use this rule to define most of the PA.
We define the primary channel shown in bold.
and subchannels for each subwave in lighter color.
Annotations shown on chart.
We see waves A and B of 3 clearly.
When you get into the subdivision of C, that's where you have to pay attention to detail.
Two conflicting things are shown.
By EW rules you have another leg up. This also makes sense from the geometry of an expanding diagonal - you want to put in that awkward third wave.
This would align with a channel break which is typical.
However, if you look at the 4 hr RSI, you are already getting a reaction at 70. For this reason, I am not swing trading this last "potential wave up."
I am waiting for a retrace of wave 4... might take a few months.
However, I am still holding my long-term RYCEY as it is possible that stock pops during this last leg up.
You usually see w4 marked by the channel bottom, and w5 must be larger than w3.
For this structure, that would lead to a >50% gain.
Here is my Boeing BA chart as reference which shows a very similar sort of relationship in movement, albeit coiling down triangle rather than impulse.
RYCEY

Raytheon Tech. (RTX)RTX achieved better-than-expected profitability across all of its reportable segments in the first quarter and recently raised its dividend with a quarterly distribution now stands at $0.51 per share. RTX represent an interesting exposure to the aerospace and defense industry, by ither side company levels of commercial air travel to return to pre-COVID-19 levels until at least 2023.


Possible continues trend up, with new ATHPlease note this is only an idea, invest at your own risk.
The price shows a nice and steady move up high, supported by trendlines . There should be support by the 20MA, which can act as good entry point. Additionally, there should be a support at 84, which acts as key support. If this breaks, setup might become invalidated.
A safer play can be to wait an approach to 20MA, and ride it up to 92. Then expect price to eventually test 93 resistance.
If can surpass 93 resistance, expect new ATH .
Happy to get feedback on my idea.

$RTX with a Neutral outlook following its earnings #Stocks The PEAD projected a Neutral outlook for $RTX after a Positive under reaction following its earnings release placing the stock in drift A
If you would like to see the Drift for another stock please message us. Also click on the Like Button if this was useful and follow us or join us.

RTX - Long Term Bullish trend developing...RTX is in the early stages of a Long-Term bullish trend. Play to the upside as long as the price stays above the Ichimoku BLUE Turning Line.


FOLLOW UP RTX LOOKIN GOOD TO SHORTI had stated on a study previously the chances of RTX shooting high or stretching out grom the looks of it RTX had its time to shoot up but failed a conformation was made tofsy that it will drop to form a “U” again you heard it hear first a little more unorthodox feom other traders and stufied but still gold happy trading i now call this position a “short”

GET READY FOR RTX VOLATILITY TOMORROW 03/31/21
Volatile day tomorrow determines the short near future for RTX you heard it here first.

ANOTHER FREE QUICK MONEY PLAY FROM YOURS TRULYHello, Most of you are new followers let me be brief me as a trader im inpatient and very impulsive that alone makes me make mistakes on my trades but im a real person when it comes to options trading im extremely passionate have been for 7 years you can check to see how long this account has been open, That being said one of my strengths is predicting price action and im deadly accurate, Its almost a spirtual feeling ive learned to understand and consolidate....
Lets talk free money, RTX my grandpas retirement stock originally UTX until bought out made my first 1,000% with this company I love how cheap there option contracts are and how slow and fast price action can move, A slow day turning into a volatile day the day of you owning a “call or put” is extremely profitable its almost a cheat code...
When I see this current chart at its current state, I see 2 things that are inevitable to happen its either one or the other, But its not a week process or even a 4 day process, if RTX is going to shoot up its by the end of this week...
Im waiting on a confirmation tomorrow (03/30/21) if this stock is green a STRONG candle a jump up is EXPECTED, But if otherwise happens and price action stays the same or even dips and closes red expect a drop to happen again all within 6 trading days...
Given 2 days for the price to shoot up if tomorrow is GREEN and closes green i will purchase a call if tomorrow closes RED and closes red i will purchase a put all for next week.
Its either one or the other keep your eyes on this fast money olay because thats what im here for fast money option plays....
I will show you with this prediction how accurate I am how consistent with my predictions I am, I will follow up tommorow again do not purchase any contracts yet until i give the go tomorrow.. HAPPY TRADING!

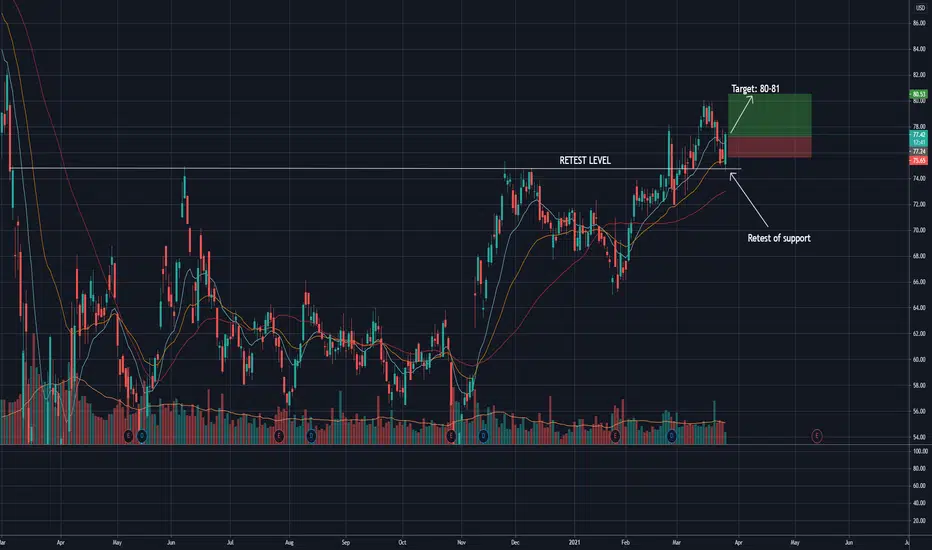
RTX RetestRTX has just retested is support level of 75. 75 was the previously resistance that was broken out of and rallied to the 80 range. Since then it was come back to retest the 75 which is now support, after retesting that level it has rallied on a good green candle and back above its moving averages. This looks bullish back to the 80-81 range as a retest w/ remount play.