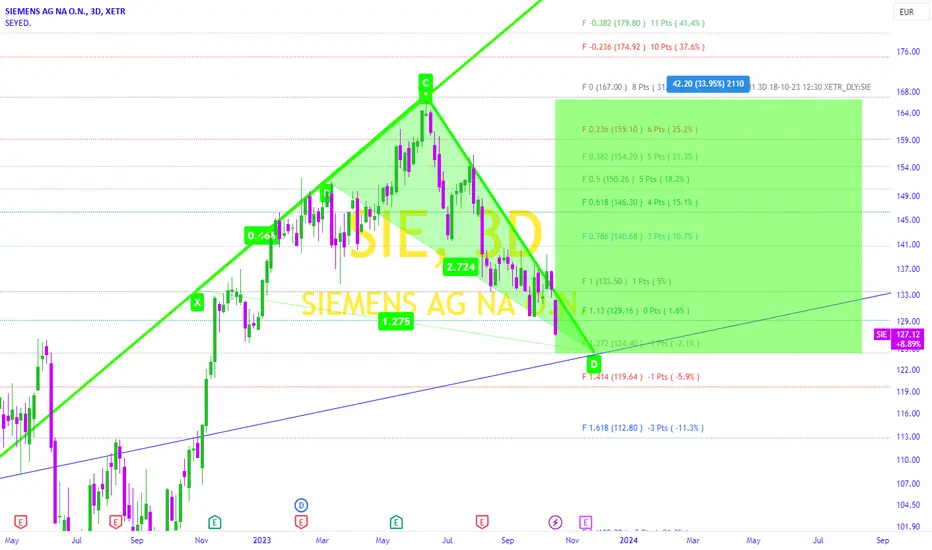
Flag Flutters Precariously: Navigating the Sky of Greed.The Siemens flag, once a symbol of ambition, now hovers in the sky of opportunistic buyers. Previously, it was plummeting toward the ground, but a swarm of butterfly-like buyers, armed with unwavering determination, managed to lift it back up using a sturdy candlestick.
However, in this latest t
Next report date
—
Report period
—
EPS estimate
—
Revenue estimate
—
12.50 EUR
8.30 B EUR
75.93 B EUR
722.93 M
About SIEMENS AG NA O.N.
Sector
Industry
CEO
Roland Emil Busch
Website
Headquarters
Munich
Founded
1897
ISIN
DE0007236101
FIGI
BBG00GY18F93
Siemens AG is a technology company, which engages in the areas of automation and digitalization. It operates through the following segments: Digital Industries, Smart Infrastructure, Mobility, Siemens Healthineers, and Siemens Financial Services. The Digital Industries segment offers a product portfolio and system solutions for automation used in discrete and process industries. The Smart Infrastructure segment includes products, systems, solutions, services and software to support a transition from fossil to renewable energy sources. The Mobility segment combines all Siemens businesses in passenger and freight transportation. The Siemens Healthineers segment develops, manufactures, and sells diagnostic and therapeutic products, and services to healthcare providers. The Siemens Financial Services segment focuses on financing solutions for Siemens’ customers as well as other companies in the form of debt and equity investments. The company was founded by Johann Georg Halske and Werner von Siemens on October 12, 1847 and is headquartered in Munich, Germany.
Related stocks

Effort of the Young Green Butterfly to Raise the Siemens Flagthe detail is shown in the above Chart.
I made this Idea based on Candlestick Analysis and Fibonacci Tool .
The Buyers' Crab could reach the highest point at the price of 167 euros.
The Bearish trend started and siemens flag is falling and approaching to the golden level of buyers crab .
Short, target 184.9Following Siemens in daily chart.
I am mostly bearish in German stocks. For Siemens, I got a weekly short call o Monday and today a short call again in daily chart.
TP1 188.6
TP2 186.2
TP3 184.9 - my main target.
You can stop above 195 daily candle close.

parallelChannel+Fib0.61: Siemensnice HH-HL forming at monthly level, curent price level is close to HL, 0.61 fib level and at monthly support. seems nice setup to trade with good R:R


[S-004] Siemens AGIdea number S-004 | Siemens stock could fall toward support in the 126/124 EUR area.
The setup is negative, the stock is trading below the 20-day and 50-day moving averages. The MACD is negative and below its signal line. The RSI is trading below 30. This could mean that the stock is in a sustained

Siemens ,,, Buy opportunity Uptrend
It's a breakout and as you see the trend is favorable for getting a buy position be setting SL at a good place. Next target can be about 157 .


SIE // Inverted shoulder head shoulder formationAlthough there is an inverted shoulder head shoulder formation on the chart, pay attention to the wedge resistance in the weekly time frame. Targets are determined according to Fibonacci.

See all ideas
Summarizing what the indicators are suggesting.
Neutral
SellBuy
Strong sellStrong buy
Strong sellSellNeutralBuyStrong buy
Neutral
SellBuy
Strong sellStrong buy
Strong sellSellNeutralBuyStrong buy
Neutral
SellBuy
Strong sellStrong buy
Strong sellSellNeutralBuyStrong buy
An aggregate view of professional's ratings.
Neutral
SellBuy
Strong sellStrong buy
Strong sellSellNeutralBuyStrong buy
Neutral
SellBuy
Strong sellStrong buy
Strong sellSellNeutralBuyStrong buy
Neutral
SellBuy
Strong sellStrong buy
Strong sellSellNeutralBuyStrong buy
Displays a symbol's price movements over previous years to identify recurring trends.
USN82008AM0
SIEMENS FINANC.16/46 REGSYield to maturity
6.31%
Maturity date
Sep 15, 2046
A1G85D
SIEMENS FINANC. 12/42 MTNYield to maturity
6.13%
Maturity date
Sep 10, 2042
USN82008BB3
SIEMENS FIN 21/41 REGSYield to maturity
6.12%
Maturity date
Mar 11, 2041
USN82008AT5
SIEMENS FINANC.17/47 REGSYield to maturity
5.96%
Maturity date
Mar 16, 2047
SI9L
SIEMENS FINANC.15/45 REGSYield to maturity
5.84%
Maturity date
May 27, 2045
XS0906140966
SiemensFinancie 3,5% 20/03/2028Yield to maturity
4.80%
Maturity date
Mar 20, 2028
USN82008BA5
SIEMENS FIN 21/31 REGSYield to maturity
4.65%
Maturity date
Mar 11, 2031
USN82008AX6
SIEMENS FIN 21/26 REGSYield to maturity
4.58%
Maturity date
Mar 11, 2026
A1G85C
SIEMENS FINANC. 12/25 MTNYield to maturity
4.49%
Maturity date
Sep 10, 2025
USN82008AL2
SIEMENS FINANC. 16/26REGSYield to maturity
4.32%
Maturity date
Oct 15, 2026
USN82008AZ1
SIEMENS FIN 21/28 REGSYield to maturity
4.23%
Maturity date
Mar 11, 2028
See all SIE bonds
Curated watchlists where SIE is featured.


Frequently Asked Questions
The current price of SIE is 215.30 EUR — it has decreased by −4.57% in the past 24 hours. Watch SIEMENS AG stock price performance more closely on the chart.
Depending on the exchange, the stock ticker may vary. For instance, on VIE exchange SIEMENS AG stocks are traded under the ticker SIE.
SIE stock has fallen by −4.48% compared to the previous week, the month change is a −0.99% fall, over the last year SIEMENS AG has showed a 28.57% increase.
We've gathered analysts' opinions on SIEMENS AG future price: according to them, SIE price has a max estimate of 260.00 EUR and a min estimate of 185.00 EUR. Watch SIE chart and read a more detailed SIEMENS AG stock forecast: see what analysts think of SIEMENS AG and suggest that you do with its stocks.
SIE stock is 5.72% volatile and has beta coefficient of 1.56. Track SIEMENS AG stock price on the chart and check out the list of the most volatile stocks — is SIEMENS AG there?
Today SIEMENS AG has the market capitalization of 167.14 B, it has decreased by −4.25% over the last week.
Yes, you can track SIEMENS AG financials in yearly and quarterly reports right on TradingView.
SIEMENS AG is going to release the next earnings report on Aug 7, 2025. Keep track of upcoming events with our Earnings Calendar.
SIE earnings for the last quarter are 2.83 EUR per share, whereas the estimation was 2.47 EUR resulting in a 14.51% surprise. The estimated earnings for the next quarter are 2.31 EUR per share. See more details about SIEMENS AG earnings.
SIEMENS AG revenue for the last quarter amounts to 19.76 B EUR, despite the estimated figure of 19.26 B EUR. In the next quarter, revenue is expected to reach 19.30 B EUR.
SIE net income for the last quarter is 2.25 B EUR, while the quarter before that showed 3.71 B EUR of net income which accounts for −39.24% change. Track more SIEMENS AG financial stats to get the full picture.
Yes, SIE dividends are paid annually. The last dividend per share was 5.20 EUR. As of today, Dividend Yield (TTM)% is 2.44%. Tracking SIEMENS AG dividends might help you take more informed decisions.
SIEMENS AG dividend yield was 2.87% in 2024, and payout ratio reached 49.40%. The year before the numbers were 3.46% and 46.80% correspondingly. See high-dividend stocks and find more opportunities for your portfolio.
As of Aug 2, 2025, the company has 327 K employees. See our rating of the largest employees — is SIEMENS AG on this list?
EBITDA measures a company's operating performance, its growth signifies an improvement in the efficiency of a company. SIEMENS AG EBITDA is 12.82 B EUR, and current EBITDA margin is 16.75%. See more stats in SIEMENS AG financial statements.
Like other stocks, SIE shares are traded on stock exchanges, e.g. Nasdaq, Nyse, Euronext, and the easiest way to buy them is through an online stock broker. To do this, you need to open an account and follow a broker's procedures, then start trading. You can trade SIEMENS AG stock right from TradingView charts — choose your broker and connect to your account.
Investing in stocks requires a comprehensive research: you should carefully study all the available data, e.g. company's financials, related news, and its technical analysis. So SIEMENS AG technincal analysis shows the sell today, and its 1 week rating is buy. Since market conditions are prone to changes, it's worth looking a bit further into the future — according to the 1 month rating SIEMENS AG stock shows the buy signal. See more of SIEMENS AG technicals for a more comprehensive analysis.
If you're still not sure, try looking for inspiration in our curated watchlists.
If you're still not sure, try looking for inspiration in our curated watchlists.