NOW: I see weakness and will take a loss on my calls tomorrowThis is coming down to 280 after er tomorrow imho.
ADX is giving me a clean signal.
SNOW trade ideas

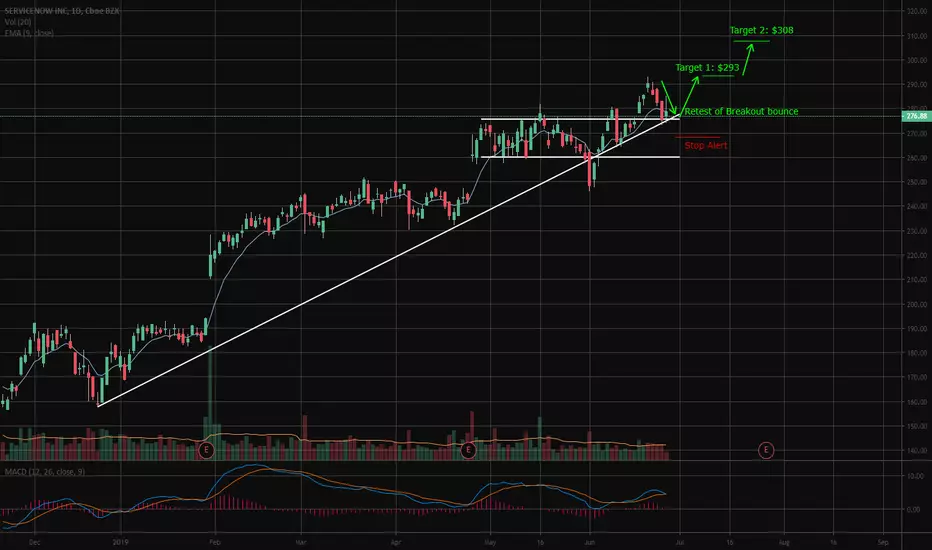
NOW Retest BounceNOW has retested its old breakout level of $275. If it can hold a green candle but the close we can see a retest of the high at $293 with a potential stretch even higher. Retests give a second opportunity to get into stock after a breakout and give the momentum to go above the old breakout high.
NOW has support for breakoutPotential breakout above moderate support zone. If the price can hold above zone can have strong support while waiting for a breakout or selling a spread.

$NOW ShortLooks like a good short on the weekly LOG chart for $NOW -- top of channel, and way way way overdone

What NOW?NOW has released earnings few days ago with a surprise of around 95%!!! From yahoo finance news release we can read that the company is currently in the business of digitizing corporate operations but this represents just a little fraction of what the automation market will cover. ServiceNow will be the leader in the automation revolution and should achieve huge financial results. I wouldn't be surprise to see the stock keeping an upward trend for long time!
Although it's a bit expensive I would buy some and hold them for a while ;)


$NOW to $250 then fallNOW showing signs of RSI divergence and reaching psychological resistance level of $250. Expect it to get close/touch it then fall back down.


NOW longThis is a long term investments
SL- red lines
TP- green lines
* please note that the overall market is in a critical point ( high risk) so please keep your stop loss in place.
G luck!


$NOW ... Yet nother majorly overdone tech stock at resistance$NOW gapped back into channel after a very clear inverse h&s... Now its sitting at the top channel line and ready to reverse imo.

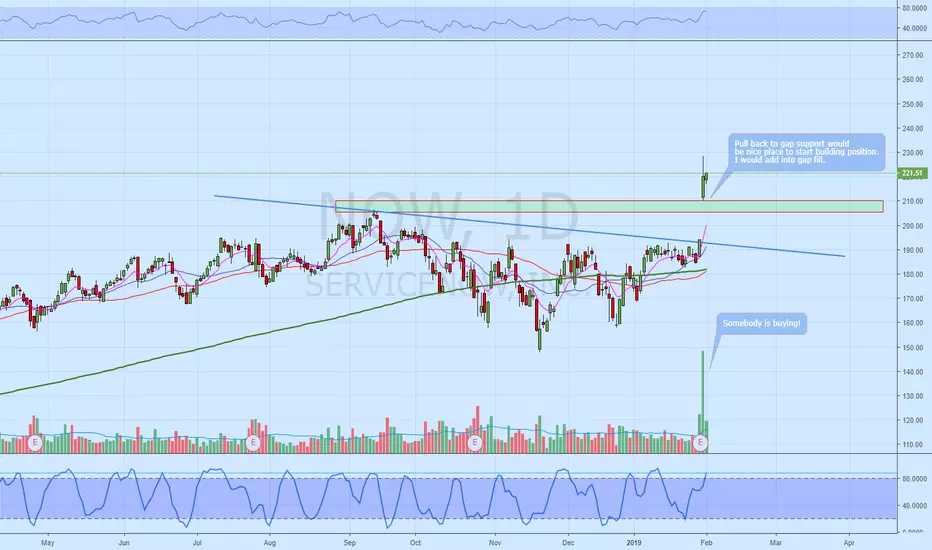
NOW Gapped to new highs on massive volumeI will start building a position if price pulls back to gap support and add if price falls further to fill gap.


NOW Inverse H&S into longer term channel breakdown.I believe that $NOW will inverse h&s and retest the previously broken channel breaking down much further long term

NOW quality stock with earning coming uptesting 200 day
Zacks Rank: 3-Hold 3 Style Scores: F Value | A Growth | A Momentum | B VGM Industry Rank: Bottom 34%(168 out of 255) Industry: Computers - IT Services


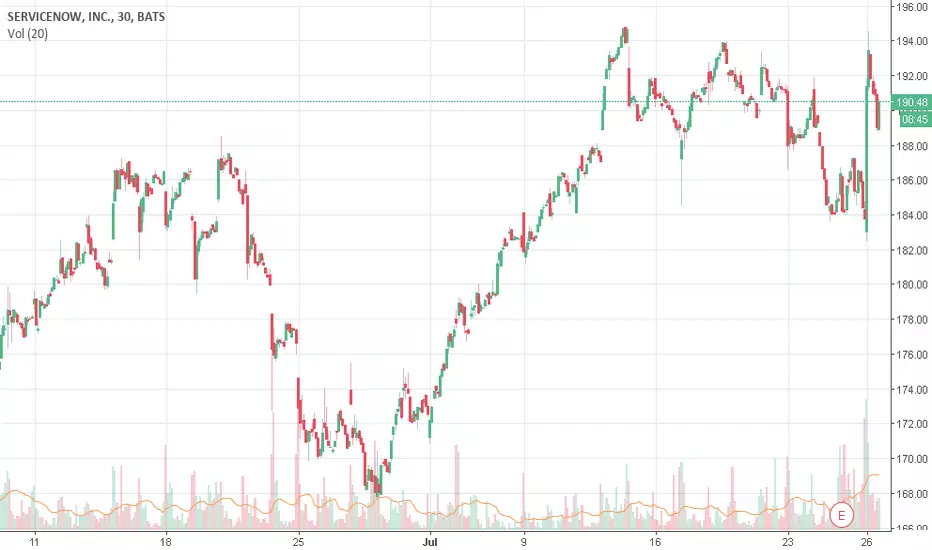
Buy opportunity: ServiceNow bounces on MA100 and trend lineHi Traders!
NYSE:NOW just bounced back from the 100 Moving Average and ascending trend line.
It is on a clear uptrend (price > 100MA > 200MA).
Stochastic RSI is in oversold area.
Entry strategy: price cross above 190.70
If you think this analysis is useful and you want to receive new updates about this idea, leave your comment or your LIKE!
Thank you for your support and may the markets be with you!

Is the entry point for NOW now?
7% Potential
1-2% Stop Loss
Repeatedly bounce between the support and resistence of this ascending parallel channel

86.11% Chance NOW Will Go UpBased on my trading system "Consecutive System" (see my published scripts) NOW is looking like a solid buy.

Don't look $NOW - potential bounce or massive H&SOverall looks bullish and we should see a decent bounce here but if the channel fails massive H&S

NOW Detected possible increase in guidance!!!NOW: servicenow inc
2018-07-25 16:10:07
Detected possible increase in guidance