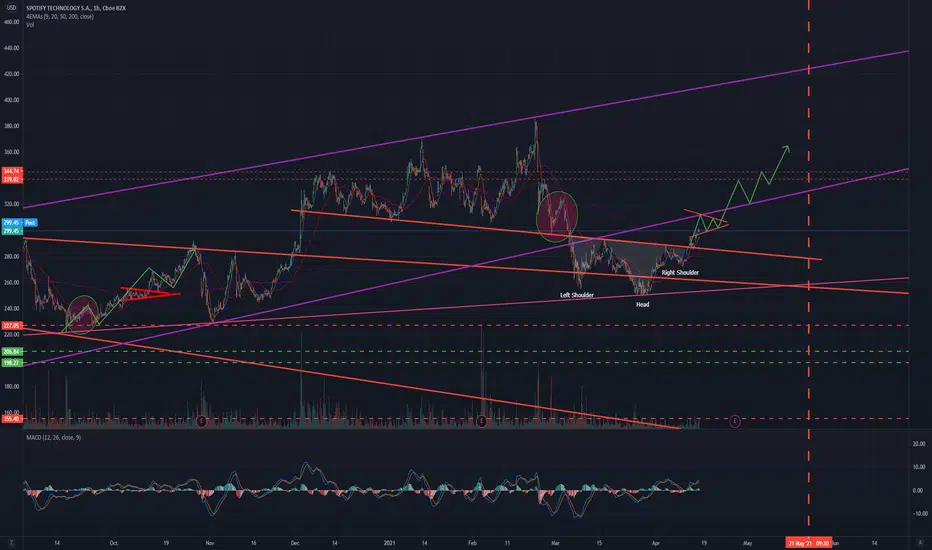
SPOT LONG!Go long on this name.
Inverse head and shoulders, will retest trend and consolidate in 310s before leg up on earnings.
LT target = 400
SPOT trade ideas

Spot to 330 by end of AprilSo many reasons to love this daily chart.
inverse head and shoulder pattern
breakout and retest of downtrend line with decent volume
rsi bullish
macd looking to crossover bullish soon
great business overall
personally love podcasts
looking for an easy retracement back to its 0.618 at a PT of 334 by end of April.

SPOT Potential sell zone approachingI'm expecting to see the price find its way into a strong fib zone and resistance level and then maybe a sell off. I don't trade the high or lows, I wait for confirmation before I press the trigger


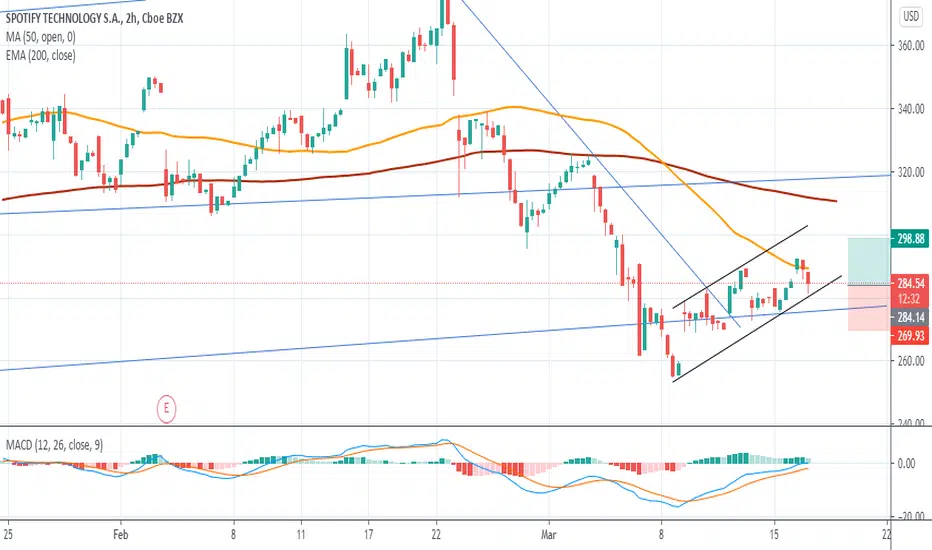
SPOT coiling$SPOT Trading within tightening range
- Closed above the 20 SMA
- Challenging the 200 SMA/EMA
- Closed above the 8 ema while challenging the 21 EMA
Nice bounce of lower trend. May need some time but see this testing 305


SPOT🌦Pattern recognized: Running flat Elliot Correction Wave.
Thesis: Bullish sentiment.
Conclusion: Waiting for signal on the 5 min.
My strategy: MEWT (MODIFIED ELLIOT WAVE THEORY).
***This does not constitute financial advice.***

SPOT liquidation breakAnother tech with a big liquidation break pattern(b shape). Since there is plenty that has this shape now I'm trying to see who will be the "leader". Others that look similar are SHOP, AMZN, DDOG, TWLO, ORCL, and prob more. Hopefully, we can play them all the same.


Music For Trading and InvestingWe teamed up with a behavioral psychologist to look into the science behind the best song choices for trading and investing. We identified a formulae based on the five essential components of music — Tempo (BPM), Tone (T), Length and Volume (LV), Lyrics (L) and Mood (M). We then used these formulae to create two specialized playlists:
Playlist #1: Zero In - Songs that aid concentration and can be used when researching your next moves.
Playlist #2: All Out - Songs that encourage you to be decisive and a confident to take action.
You can find both of these playlists free and open to everyone on Spotify . We'll be updating them as we go. In addition, please feel free to share your favorite songs for trading in the comments below.
Now let's dive into the calculations behind each playlist. You may find this part especially interesting if you're passionate about music or looking to learn more. You may also realize that markets and music have a lot in common.
🎯 Zero In — Time To Focus and Concentrate
Focusing = “BPM (50 – 65) +TM +LVL (+ or -) -LN +M”
BPM: find songs with a tempo of 50-65 beats per minute
TM: select a mellow tone that soothes and relaxes
LVL: longer songs make for better concentration
LN: choose a track with few or no lyrics
M: a slow, less melodic mood will help the brain focus on the task at hand, and not the music
💥 All Out — Building Confidence To Make That Final Leap
Action = “BPM (65 – 85) +TU +LVS (+ or -) -LS +M”
BPM: find songs with a tempo of 65-85 beats per minute
TU: select an upbeat tone that positively enhances cognitive function
LVS: shorter songs with a faster tempo will keep you motivated when performing a task
LS: During Activation of a task, having lyrics in your playlist, is less important, so choose songs with some lyrics that motivate
M: an upbeat, lyrical mood will give you a boost of dopamine, helping you feel brave and confident
Thanks for reading and we look forward to hearing your feedback. Go ahead and give these playlists a try. Let us know how they help you prepare and take action. Please also share your favorite songs for trading in the comments.


Confirmed its bearish mode!I always try to present the charts in a simple comprehensive format to prevent any confusion.
This is just my technical view, neither a fundamental comment nor a recommendation to trade..!
Please review my track record and calculate the odds for yourself..!
You’re likes and comments encourage me to continue this.
Stay tuned great live stream and quality content videos coming soon..!
Spotify Looks like its found a bottomThe signals are have aligned to suggest a bottom.
Looks like a buy to me.
Please note, this idea is shared for educational and discussion purposes only and should not result in speculative investment decisions in any asset class.

Time to start accumulatingDrew this fan a year ago and it's playing out now. We're in the bottom section of the fan and it looks like we bounced off the 245 support.

SPOTCould have just been one last shake out over the last few days. Lots of resistance in the $350-360 area. Couple targets above.

SPOT - BUY ZONE - MAKE PROFITI bought SPOT, what about you?
Good company, good price in good buy area.

SPOT looks choppyGood bounce from the bottom of a low volume zone. Seems like it will be pretty choppy though.

SPOT at big level to watch$SPOT - At 100ema, also big resistance level, lets see if this become support too, up side target 348 & 370, downside 245 & 227

Keep Spotify on your watchlist..!We see Spotify for the 4 the time in the last year touched the trend line and bounced back. In the last two days it made higher high + higher low pater which is in favor of finished correction!
Wait for close daily candle closure above 345 for safer entry point.

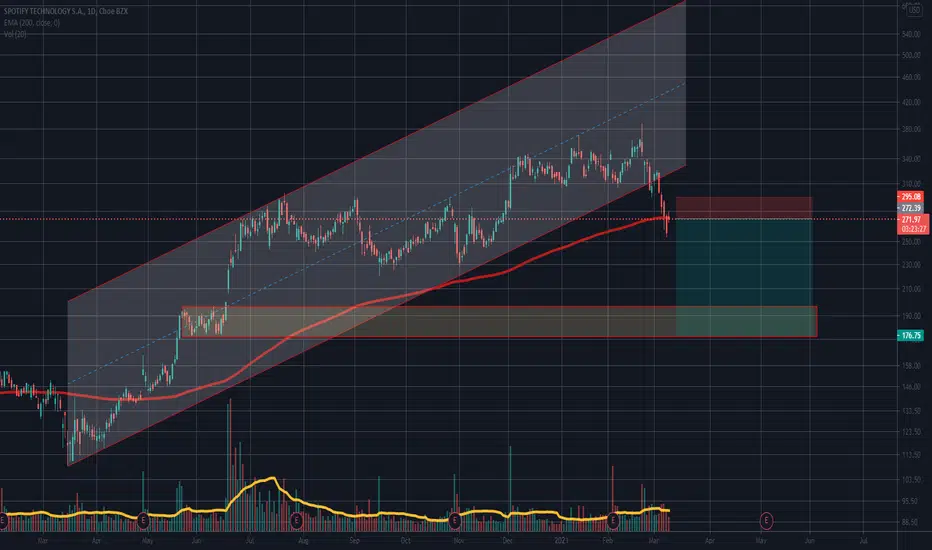
Spotify Stock to Lose Half of its 2020 UptrendIs this a good time to join Spotify bulls? Let’s see how the situation looks like from an Elliott Wave perspective.
The daily chart above puts Spotify advance from its December 2018 low in Elliott Wave context. The chart reveals that the uptrend from the 2018 low at $103.66 is shaped as a complete five-wave impulse. The pattern is labeled 1-2-3-4-5, where the five sub-waves of wave 5 are also visible.
There is also a good alternation between the correction, wave 2 is a time-consuming flat pattern that completed during the coronavirus panic of 2020, and wave 4 is a sharp zigzag move. According to the theory, a three-wave correction follows every impulse.
The corrective phase of the Elliott Wave cycle typically erases the entire progress achieved by the fifth wave. Applying this to SPOT stock makes us expect a decline back to the support of wave 4 near $220 a share . If this count is correct, a ~43% drop from the top at $387 seems to have just begun. The double bearish RSI divergence between waves 3 and 5 also indicates the bulls are running out of steam
What's your view on Spotify Stock? Let me know in the comment section.
Thanks for reading!
Veejahbee.
