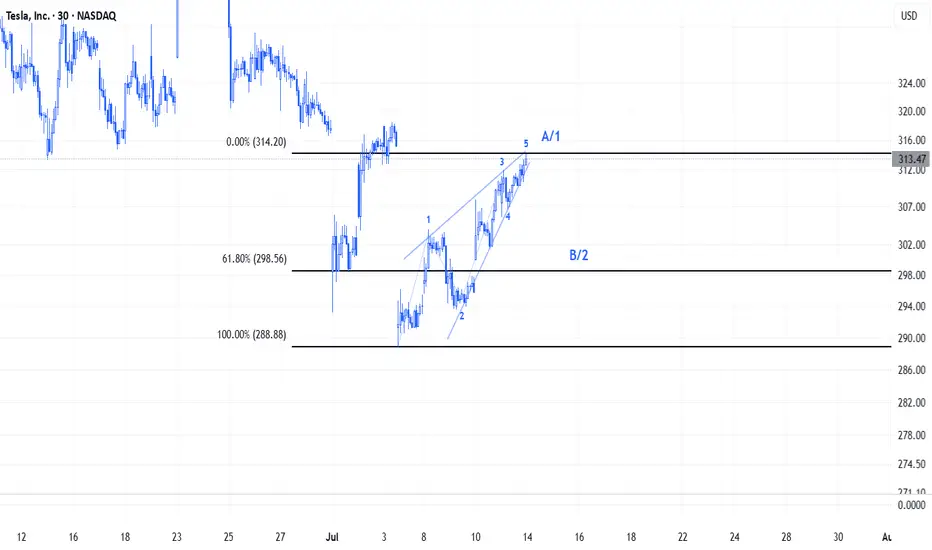
TSLA Elliott Waves We can clearly see that a Leading Diagonal is formed on TSLA's chart.Leading Diagonal usually occurs on Wave A or Wave 1.After this chart pattern, a correction often follows reaching nearly the 61,2% fib levels of the Diagonal
TSLA trade ideas
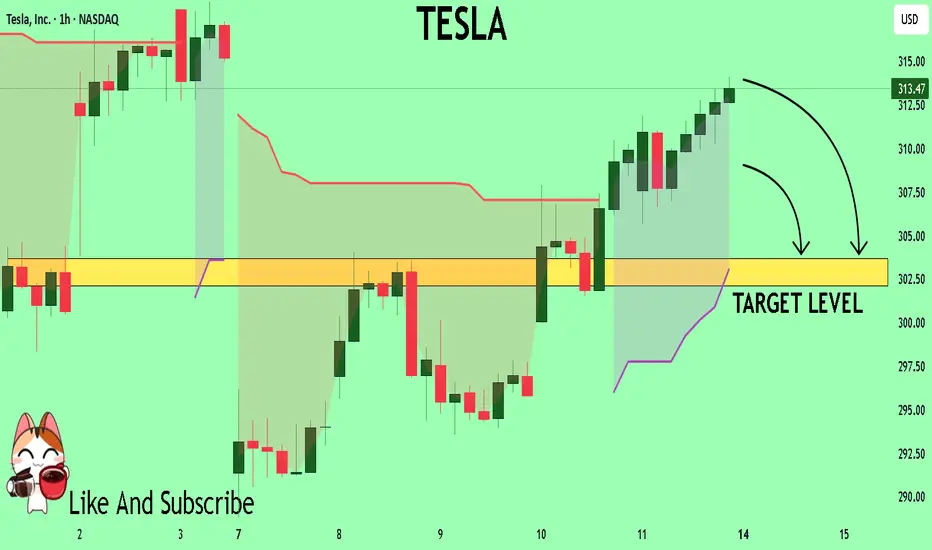
TESLA My Opinion! SELL!
My dear friends,
Please, find my technical outlook for TESLA below:
The price is coiling around a solid key level - 313.47
Bias - Bearish
Technical Indicators: Pivot Points Low anticipates a potential price reversal.
Super trend shows a clear sell, giving a perfect indicators' convergence.
Goal - 303.67
About Used Indicators:
The pivot point itself is simply the average of the high, low and closing prices from the previous trading day.
Disclosure: I am part of Trade Nation's Influencer program and receive a monthly fee for using their TradingView charts in my analysis.
———————————
WISH YOU ALL LUCK
$Tsla $350 looks promisingNASDAQ:TSLA $350 looks promising in the upcoming weeks.
AMEX:SPY NASDAQ:QQQ NFA
I am bullish on TSLAI have not changed my buy bias for this baby.
II will continue adding TSLA to my portfolio with $360 and $400 as my medium-term take profits.
Share your thought.
If you found this helpful, like, follow and share

TESLA: Bearish Forecast & Bearish Scenario
Our strategy, polished by years of trial and error has helped us identify what seems to be a great trading opportunity and we are here to share it with you as the time is ripe for us to sell TESLA.
Disclosure: I am part of Trade Nation's Influencer program and receive a monthly fee for using their TradingView charts in my analysis.
❤️ Please, support our work with like & comment! ❤️

How We’ll Trade Earnings This Season Earnings season is almost here — and if you're with QS, you’re already holding the most powerful edge in the market.
Let me walk you through how QS trades earnings, why we built 💸earning-signal, and how you can use it most effectively this quarter.
---
📜 A Little History: The Birth of 💸earning-signal
When QS launched in early April, we started with just two short-term signals:
⏰0dte
📅weekly-options
Both focused on short-term options trades.
Then came TSLA earnings in late April. That’s when we launched our very first 💸earning-signal — and nailed the prediction.
Since then?
We’ve had one of the best earnings win streaks on the internet. Period.
📌 Don’t take my word for it — check:
#✅signal-recap for the track record
#🤑profits and #🤩member-testimonials for real wins from members
---
🤖 Why We Built a Separate Earnings Signal
Earnings are not regular trading days. The dynamics are completely different.
On normal days, a stock might move <1%
On earnings? 10–20% swings are common
This is what we call a “pivot event” — and it requires a different engine to predict.
That’s why we separated:
📅 #weekly-options → normal day-to-day setups
💸 #earning-signal → high-volatility earnings plays
---
🧠 How a Human Would Trade Earnings...
If you wanted to manually trade an earnings report, you’d need to analyze:
Past earnings reactions
Analyst expectations
Earnings call language
Financial statement surprises
Options IV & skew
Post-earnings stock behavior
This would take hours (or days) — and most retail traders don’t have time.
---
⚙️ How QS AI Does It Instead
We built 💸earning-signal to do all that work for you — and more.
✅ It pulls in all the data above
✅ Runs it through 5 top LLM models (each acts as an independent analyst)
✅ Aggregates their insights + calculates probability-weighted direction & strategy
✅ Uses fine-tuning to learn from its past prediction success/failures
This means: faster decisions, deeper insights, and better accuracy — every week.
We don’t just run predictions. We let the AI learn from past mistakes and self-improve each quarter.
---
💥 Results Speak for Themselves
Last season, we nailed:
TSLA
MSFT (10x–20x winners!)
NVDA
AAPL
And many more...
All based on this unique AI-driven earnings analysis stack.
This season?
We’re going harder, faster, and even smarter. 📈
🎯 The goal is clear:
Make 💸earning-signal the #1 earnings prediction system in the world.
---
🧩 Final Notes
Earnings are 10x harder to trade than regular days
But with QS, you’re equipped with 500x the speed and insight of an average trader
Upgrade if you haven’t yet: #💰upgrade-instructions
Earnings season kicks off next week
Let’s get it.
Let’s win big.
Let’s make season 2 of 💸earning-signal our most legendary yet. 🚀💸

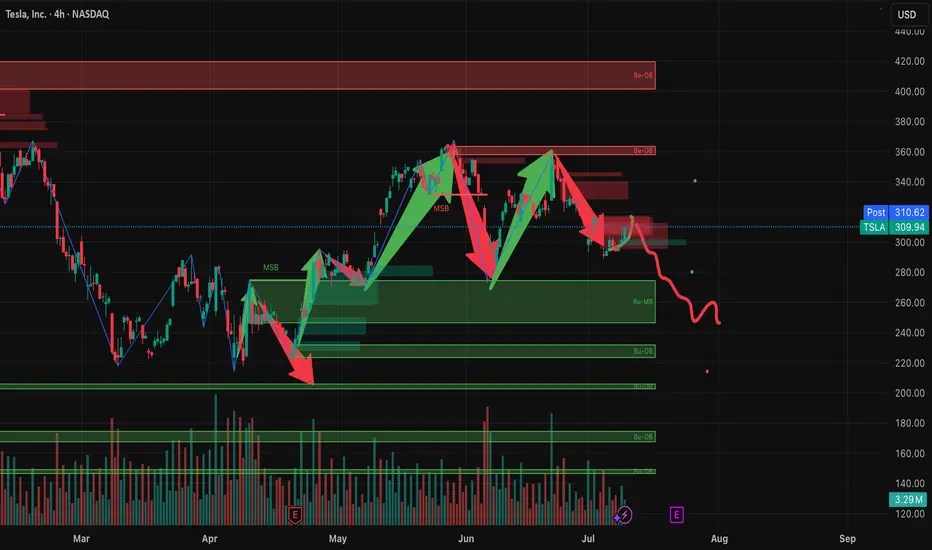
Tesla - Major Breakout BrewingTesla has been going through the wringer, between Robotaxi news, tariffs and the ongoing feud between the most powerful man in the world (Trump) and the richest man in the world (Elon). No doubt the news has had its fair share of impact on the stock. But Technicals will always hold more weight than news. I'll breakdown a few reasons why I believe this stock is due for a major run to ATHs
As you can see on this 4H chart, a nice falling wedge is forming and PA is respecting it, even with the wild gaps. On top of this being a bullish pattern, TSLA is also in a crucial area of support within the $290s . If you look back to Jun 9th 2025, you can see Tesla bounced from the 281 level to the 330s which is another indicator of strong support. Not to mention, a the 50 MA crossed the 200 MA on the daily on July 1st which is another bullish indication. The wedge looks to bottom out at the 280 level but I don't see this stock going that low. $290, 291 is an optimal entry to go long.
The long term trend line from April 21st 2025 has not been completely invalidated as of yet. If it retests at 310 and falls back within the wedge, I am still bullish. If price falls under $280, I am bearish. But until then, load up because the next stop is $350 after breakout, then $400, then ATHs. I'm expecting the breakout to happen by earnings or potentially before if this unnecessary feud between Trump and Elon ends.
P.S. I didn't get a good entry on this trade but I have a long position due to expire on the 25th.
Good luck trading.
-AceBoogieWitMe

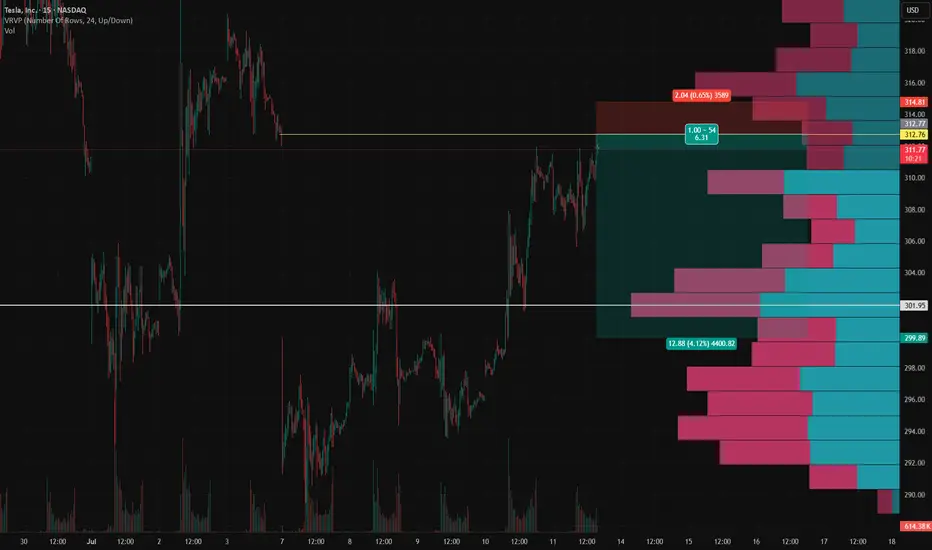
TSLA Short Setup – Fading the July 7 Gap FillTSLA Short Setup – Fading the July 7 Gap Fill 📉
This short idea on TSLA builds off a key gap fill from Monday, July 7 , combined with a strong local volume profile and risk-reward alignment on the 15-minute chart.
Entry: $312.76
Stop Loss: $314.81 (above gap resistance and local high)
Target: $299.89 (gap base and volume shelf)
RR: ~6.3R
Why I'm shorting here:
TSLA has just filled the July 7 gap , which often acts as a technical resistance zone on retest.
Price stalled right as it completed the fill — with visible hesitation and selling pressure stepping in.
VRVP shows low liquidity above, suggesting diminished reward for upside continuation.
Below, there's a clean volume shelf around $294–$300 that could attract price if weakness confirms.
Trade Logic:
This is a classic fade-the-gap-fill setup, targeting the lower edge of the volume cluster for a potential bounce or reversal zone.
As always: size accordingly, stick to the stop, and don’t chase if the entry’s already gone.
Thoughts? Anyone else watching this gap level?
TSLA, Long, 1D✅ TSLA has just broken out of a clear symmetrical triangle pattern, signaling a potential bullish continuation.
Yesterday’s daily candle was a white Marubozu, indicating strong buying pressure and clear dominance by the bulls.
LONG 📈
✅ Like and subscribe to never miss a new technical analysis! ✅

TSLA eyes on $294: Key Support for bulls to hold or face $253TSLA oscillating all over the place thanks to Musk moves.
Currently testing a key support zone $293.96-294.32.
Loss of this floor opens the Golden Genesis at $253.57
See "Related Publications" for previous charts ------------>>>>>>

Tesla (TSLA) 1-hour chartTesla (TSLA) 1-hour chart im provided, here are the key bullish target points indicated by the chart analysis:
📈 Bullish Target Points (Upside Levels):
First Target Point:
🔹 Around $338.00 – $340.00
This level is marked as the initial breakout target, likely based on recent price structure and resistance zone.
Second Target Point (Extended Target):
🔹 Around $362.00 – $364.00
This is the higher target zone, representing a potential move if bullish momentum continues strongly. Likely aligning with a measured move or previous highs.
🧠 Context:
Price has broken out of a descending triangle/wedge pattern, a bullish signal.
It's also moving above the Ichimoku cloud, showing short-term bullish trend continuation.
Holding above the breakout level (around $305–$308) is critical to maintain upward momentum.

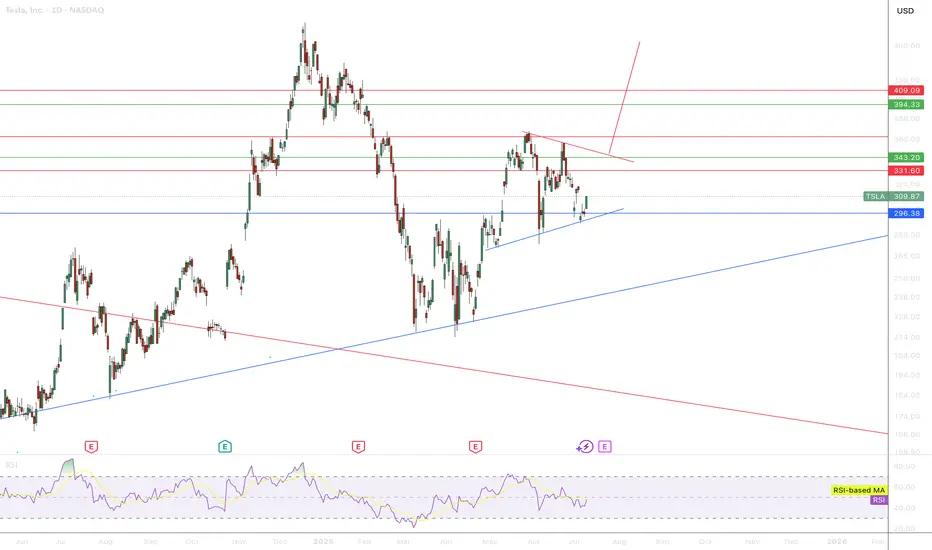
Triangle Pattern in TSLALooking at 4H-1D Chart, there is a triangle pattern emerging which may target 400 area. Good luck.
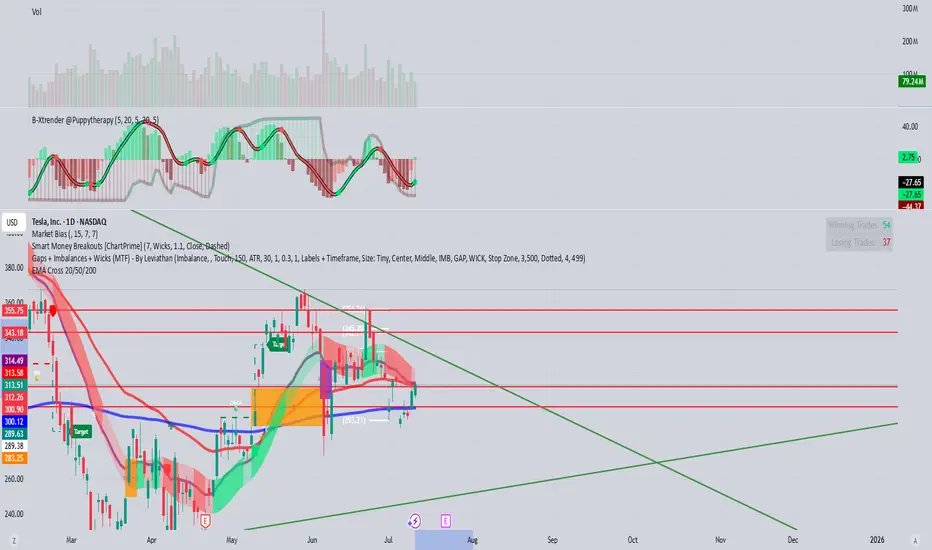
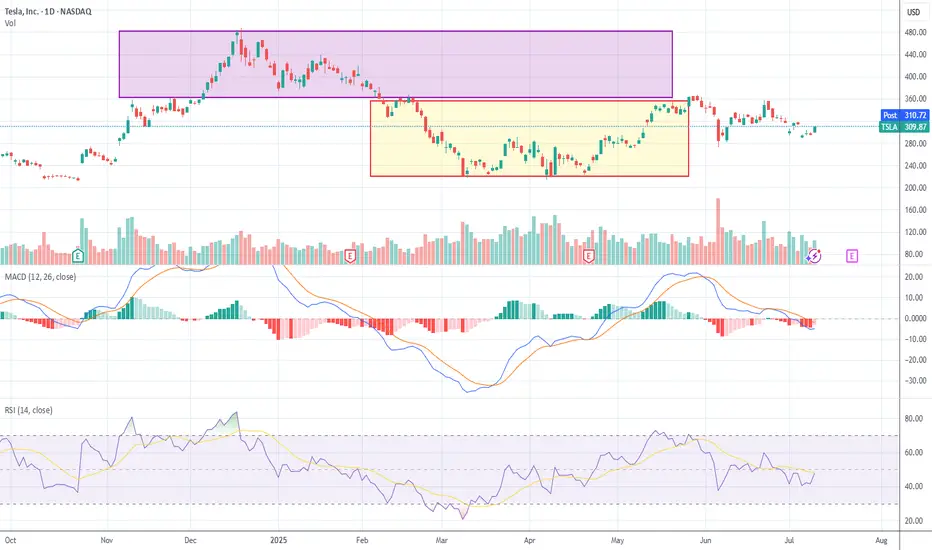
Tesla Flashes Bullish Reversal: Engulfing Candle and Volume PoinLet’s reassess TSLA now that we have this new candle (a big move +4.73%) in context. This changes things substantially, so I’ll reapply candlestick techniques, assess trend health, box positioning, and momentum.
Candlestick Analysis
The new candle:
Large white body (+4.7%) closing at $309.87. Engulfing prior 2 candles’ real bodies → this is a Bullish Engulfing Pattern. Occurs near the 50% retracement ($290) zone (previous support). Volume expanded vs prior days → adds validity. Bullish engulfing after a down leg is an early reversal signal.
Context:
This happens after weeks of indecision candles (spinning tops / dojis) → classic “coiling” behavior before expansion.
Trend Health & Momentum
MACD: Still below zero but histogram bars turning less negative → momentum starting to shift.
RSI: Up to ~47.6, breaking out of its down channel. A move >50 would confirm momentum pivot.
Box Dynamics
TSLA just punched through the upper edge of Box 2 ($300) with conviction.
Now entering “no man’s land” between Box 2 ($300–$360) and Box 1 ($360–$465).
For a sustained breakout it must close above $306–310 range for 2-3 days. Ideally see follow-through with a test of $328 (78.6% Fib).
Tactical Breakdown
✅ Breakout case (higher probability now):
Bullish Engulfing + volume expansion at support zone.
Closing above $306-310 increases odds of a run toward $328 (78.6%) and possibly $360.
❌ Reversal back down (lower probability):
Only if TSLA immediately rejects $310 and falls back below $300 in the next 1–2 sessions.
This price action looks like accumulation showing its hand. Large white candle suggests buyers absorbing supply at prior resistance.
Breakout above $306 confirmed if follow-through continues. Odds for a reversal lower just dropped sharply after today’s engulfing.
TSLA racing to break thru resistancearea 1: 340
area 2: 360
will be tuned into earnings to see if the jig is jiggin July 23rd.
Elon is busy. so let's see what's the dealio.
****280 is a key level
**300 needs to hold for these attempts

Why TSLA will Crash based On Copper TarrifsHere’s why that bearish outlook is gaining traction:
Copper costs are surging: Tesla uses over 180 pounds of copper per vehicle. With prices spiking 13% in a single day and a 50% tariff looming, production costs are rising fast.
Analysts are cutting price targets: UBS, JPMorgan, and Bank of America have all lowered their forecasts for Tesla, citing margin pressure and weakening demand3.
Brand sentiment is shaky: Tesla’s recent delivery miss and political controversies around Elon Musk have added to investor unease.
Tariff ripple effects: The broader trade war is expected to disrupt supply chains and inflate costs across the EV sector5.
That said, some analysts still see long-term upside if Tesla can pivot quickly—especially with its AI and autonomous driving ambitions. But for now, the market is reacting to the immediate risks.
Overall Enter Short for Gains of 3-5 percent.
Tesla (TSLA) Market UpdateTesla NASDAQ:TSLA shares dropped nearly 7% after Elon Musk dismissed analyst Dan Ives' suggestion to scale back his political activities. Musk also proposed a new pay package, raising concerns among investors about potential distractions from Tesla’s core business.
📊 Upcoming Catalyst:
Tesla is set to report its Q2 earnings on July 23, with investors eagerly awaiting updates on the company’s financial performance and the newly launched robo-taxi service in Austin, Texas.
⚠️ Sentiment:
Recent bearish headlines include:
Concerns over potential Robotaxi issues
The ongoing Trump/Elon Musk political drama
📈 Trading Opportunity (Long Setup):
Despite the negative sentiment, this dip could offer a solid long entry opportunity:
Entry Zone: $275–$270
Take Profit Targets:
TP1: $315
TP2: $335
Stop Loss: Close below $265

TSLA Long Idea — Buying the Support After News-Driven DipNASDAQ:TSLA price has stabilized near the key $290–291 support zone, a level that has previously triggered rebounds. This presents a solid entry opportunity with limited downside risk.
Context: The recent drop was triggered by headlines involving the U.S. President and Elon Musk. If this was mainly speculative noise, now could be the best time to buy, as the market absorbs the news and finds technical support.
Technical Setup:
• Strong support at $290–291 holding firm.
• Stochastic is in the oversold zone and starting to turn upward.
• Bollinger Bands tightening — breakout likely.
• Target: $307.45 (+4.57%)
• Stop-loss: $289.09 (−1.68%)
• Risk/Reward Ratio: 2.72
Expected move by July 9, 2025. With strong technical signals and fading news impact, this setup offers a favorable risk/reward for bulls looking to ride a rebound.

Long TESLATrading Fam,
Today my indicator has signaled a BUY on $TSLA. The technicals align. M pattern looks to have completed at strong support (RED TL) and is bouncing upwards inside of a solid liquidity block. Buyers are stepping in. I'm in at $315 and will shoot for $430 (probably taking some profit along the way). My SL is currently $241 but will trail as we enter profit.
Best,
Stew

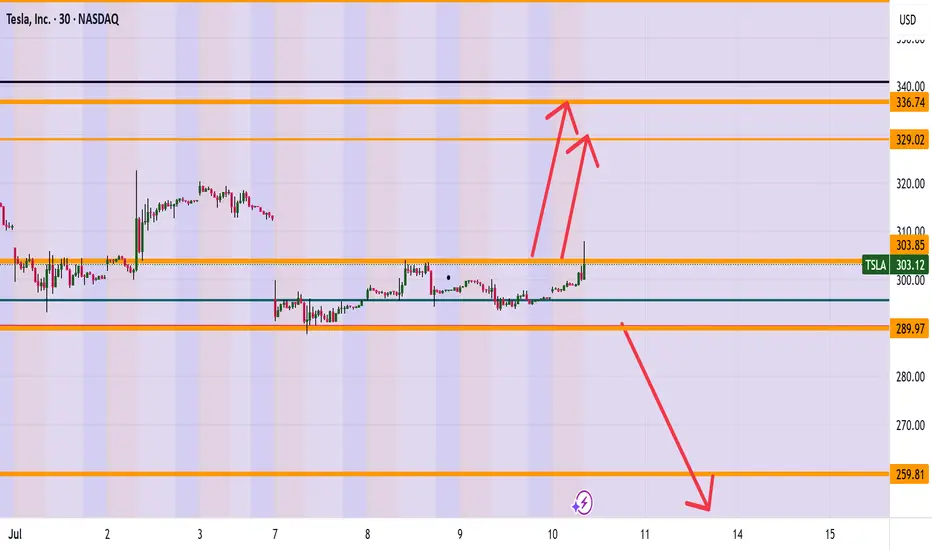
TESLA (TSLA) ARE WE HEADING TO 336? Morning Folks
It appears we are trying to break the highs of 304 and if we are successful a nice range up to 327-336 makes sense. However be careful if sink back down under 289 which then can see levels of 259 getting hit.
What are your thoughts on Tesla? Put in the comments section below
Kris Mindbloome Exchange
Trade Smarter Live Better
TSLA: Buy ideaBuy idea on TSLA as you can see on the chart after the breakout with force the resistance line by the buyers.

TSLA BUY 253.8Recently, TSLA has maintained a volatile operation. Currently, we can pay attention to the area around 253.8 below, which is a potential buying position for a bullish Gartley pattern. At the same time, this position is within the previous demand area.

TSLA Caught in Tug-of-War-TA for July 10TSLA Caught in Tug-of-War: Key Gamma & Price Action Setups Unfolding ⚠️
🔍 GEX (Gamma Exposure) Analysis:
Tesla’s options market is highly polarized heading into the week.
* Gamma Walls: Strong Call Wall near $304–$310, showing potential upside magnet if bulls regain control. Above this, the $317.5–$320 zone could trigger a gamma squeeze.
* Put Walls: The $288–$285 zone represents a heavily defended downside, marked by high negative NET GEX and multiple put walls.
* Current GEX Bias: Negative gamma regime persists, increasing potential for volatile moves and sharp directionality.
* IVX is elevated at 61.1, with IVR 17.4, suggesting the options market is pricing in moderate near-term volatility.
📈 Options Trade Ideas:
* Bullish Setup: Consider July 12/July 19 300c–310c debit spread if price confirms reclaim of $300, targeting a gamma squeeze toward $317.5–$320.
* Bearish Setup: If price breaks below $288, buy 285p–275p vertical or 295p straight puts, expecting continuation toward $280 and below.
🕒 1H Price Action Outlook:
Tesla remains stuck in a tight consolidation wedge, showing a battle between supply at $300–304 and demand near $288–290.
* Structure: Market formed a bullish BOS earlier this week but failed to extend higher. The latest CHoCH + rejection from $300 zone suggests sellers are still active.
* Range: Coiling inside a triangle formation with tightening price action. A breakout or breakdown is imminent.
* Demand Zone: The green liquidity block around $284–$288 has held firm so far.
* Trendlines: Price is being compressed between a descending trendline (supply) and ascending trendline (demand), signaling a make-or-break moment.
🎯 Intraday Trade Plan:
* Bullish Case:
* Entry: Above $300 with volume
* Target: $304 → $310 → $317
* Stop: Below $294
* Bearish Case:
* Entry: Breakdown below $288
* Target: $284 → $280
* Stop: Above $295
💭 Final Thoughts:
TSLA is in a pressure cooker. A breakout above $300 opens the door to gamma-driven upside, but continued compression or a loss of $288 support could trigger a fast liquidation. Monitor volume closely — this wedge is near resolution.
This analysis is for educational purposes only and does not constitute financial advice. Always do your own research and manage risk responsibly.

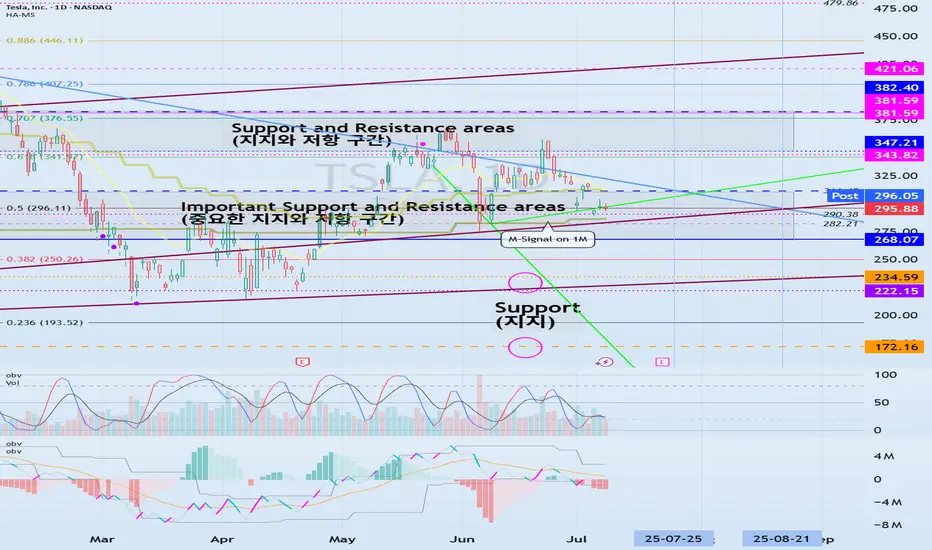
Important Volatility Period: Around August 21
Hello, traders.
If you "Follow", you can always get the latest information quickly.
Have a nice day today.
-------------------------------------
(TSLA 1D chart)
The medium-term trend is maintaining an uptrend.
However, if the price falls below the M-Signal indicator on the 1M chart and maintains, there is a possibility of a downtrend, so caution is required.
The support zone is
1st: 222.15-235.59
2nd: 172.16
Around the 1st and 2nd above.
The 268.07-311.48 zone is an important support and resistance zone.
If the price is maintained above this zone, there is a high possibility that a full-scale upward trend will continue.
However, since a resistance zone is formed in the 347.21-382.40 zone, we need to look at how this zone is broken upward.
-
When it falls to the 172.16-234.59 zone, we need to find a time to buy.
If not, we need to buy when it shows support in the 268.07-311.48 zone.
It would be better to buy at a lower price, but since the investment period will inevitably be longer, I think it is better to buy when an upward trend is detected.
-
The important volatility period is around August 21st, but before that, we need to check the movement around July 25th.
If it falls below 268.07 after August 21st, it could lead to further decline.
If it rises above 311.48 and maintains the price during the movement around July 25th, it could lead to further increase and it seems likely to create a trend after the volatility period around August 21st.
-
Thank you for reading to the end.
I hope you have a successful trade.
--------------------------------------------------