UAA take two (1)you fooled me once stupid stock. this time i will have the last laugh! i am thinking that my timing was off , if it keeps dropping i believe UAA would be overextended too the downside so even if this stock is going down a counterbounce should be in order
market = -1 (i think the overall market sp500 will stand still or drop within short time)
timing = 1 (if the stock keeps dropping its going into some support area + its very overextended on the short term down 30% i 2 month)
fractal = 0 (not much has changed here)
volume = 1 (volume is higher on the upswing then on this recent sell off so i would still consider that a +1)
group strength = 0 (when i look at the big apparel manufacturing companies they look to be doing ok , not great but ok)
UAA trade ideas

your protection needs alittle more protection (2)under armour is acting strange, its not in sync with the market which is interesting, the stock already lost 78% of its value these past 2 years so a bounce should come. Question is how big should that counterbounce be and if 25$ was all she wrote.
Volume = 0
Group strength = 1
Timing the market -1
Abcd pattern = 1
Fractal = 1

$UAA - cup and handle still intact - watch for BREAKOUTCup and handle formation still holding today, watching for breakout of consolidation for move higher. Measured move could fill gap back to ~28 range.
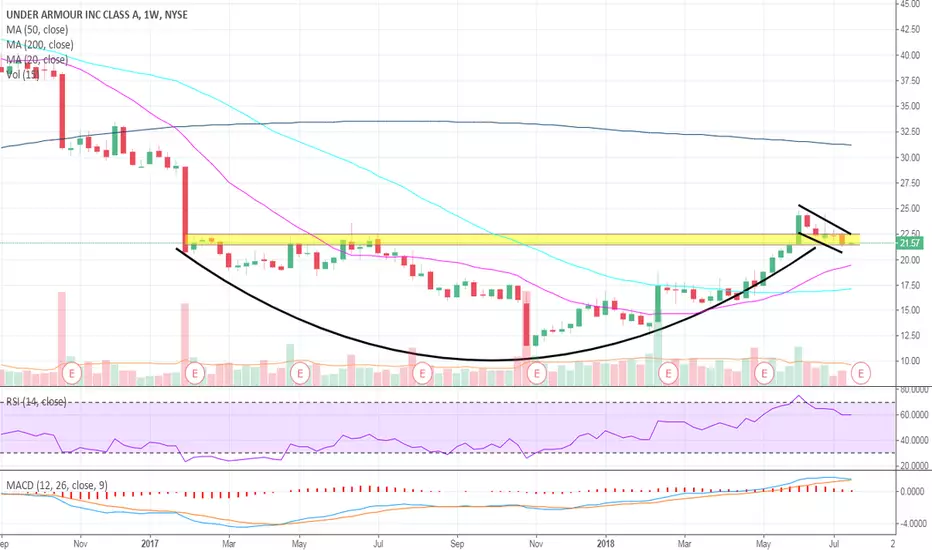
Long!Will be monitoring the fib levels for targets, its an open ended trade! Stop level is on the chart. Cheers

UA Support and Resistance Levelswith Trump and China going at each other with Tariffs this will probably sell off with the rest of the market
I would just watch a bit for now on UA - it does seem like the downward trend could be broken so it might be a good to look for a place to buy, however their fundamentals kind of suck:
www.finviz.com
low sales Q/Q & high forward P/E ratio for a retail company

Strong buySuper strong buy signal to 33$ minimum all indicator show that and fundamental also showing that!


UAA bullish pennant breakout repeat?UAA has had a minorly positive earnings report and has been in a nice uptrend since. After breaking out a few times and now forming the same technical pattern again I wonder if past events will repeat? We shall see...

$UA Weekly OKUUUUURtReally don't care too much for growth value in retail; can't say the recent / current pop isn't interesting to watch, though. Haven't seen an A+ long-term play in the sector for a while so, this one is something to watch.

UA Inverse Head & Shoulders Breaking out Now!See chart. Note: PRICE MUST BREAK RESISTANCE AT $17.47, IF IT DOES NOT the stock may consolidate in that small range or fall.
If a breakout is confirmed, at the very least I would expect UA to fill the gap between $21.4 and $24.97.

Under Armor changing directionLooks like under armor is ready to move up:
Down trend line broken
Prices broke above 200 EMA
RSI bottoming at 40% (bullish sign)
Yesterday's close was above resistance level of 18.40$
Target(s): 20.9$, 22.50$
Stop Level : Close below EMA50 (currently 16.88$)

Under Armour trending higherUAA is making a move higher inside Andrew's Pitchfork after breaking above a consolidation zone. A great short-term setup.


Under Armour Long. One of the best opportunities in U.S. stocksHuge upside potential, I expect 100%+ stock price growth.
Long-term.
Two potential 1-2s, should accelerate soon
Expected price trajectory on the chart.
Good luck!

UA Wedge BreakoutI've been following Under Armour for a while now. I don't like this stock long, but on a swing trade this might be a good play here based off how the stock breaks out of this wedge pattern. If it break above $14.50, I'd keep it with a target of about $16.20. Obviously, if the stock breaks out to the downside, I'd stay away.

Possible BreakoutI'm taking a small position on UAA with stop set at 13.50 and taking a chance on a 200 day SMA break and recovery.


New trend starting to the upside for UnderArmor Low risk trade here. UA has been in a down trend for a long time and now starting to look like it might be starting a brand new up trend.

UAA - Retest gapI'm liking this retest gap on UAA. There are still a ton of shorts in this stock and as they cover they will push this stock higher. And any news or headlines will only help.

Wait for retest to buyUA is on its way to breakout. Wait for retest to buy and hold for long term/
Follow me goo.gl
CuongFX

UA LongMaybe we have a cyclic Pattern with next high end of july. The Downtrend seems to come to an end after bouncing from 76 Retracement and making higher highs. If resistance (red box) can be broken - the way to the downward trendline may be open. If SL is under last low its a 2.3R .

Under Armour is trying to breakoutUAA has been in long term down trend.
Now I'm looking at the possibility of reversal breakout.
- weekly chart touching the upper line of descending channel.
- daily chart is showing a gap-up with strong volume.
CAUTIONS
- UAA's down trend has been solid.
- UAA's fundamental is still disappointing in terms of growth rate of revenue, eps.
- However, short term chart shows institutional demands.
- check if breakout of upper channel line occur with strong institutional buying.
