WDC trade ideas

First 80W cycle after major 56M concludedAccording to our forecast, we are moving now over the first 80W cycle bottom after the great reset in 2020.
We are getting big time into WDC now, expecting the price to go even over 100USD next year, with a safe target of 90 USD
When we proceeded with phasing analysis just around the big dump in March 2020 we saw that a major 56month cycle bottom got aligned with it.
The price moves later confirmed 100% the phasing analysis was correct.
This way we got one of best deals in 2020.
Now is the chance to get the second shot.

Same pattern?If the pattern repeats, looks like a sharp reversal in 2023. AMAT recently put out a bullish outlook.

Hard to ignore this many oversold signalsMy models say the Fed cannot raise rates beyond 0.5 points tomorrow or they cannot be trusted in the future. We should see a quick rally to end this week and perhaps begin next week, before the reality of $6+ fuel prices set in again and we continue the bear market.
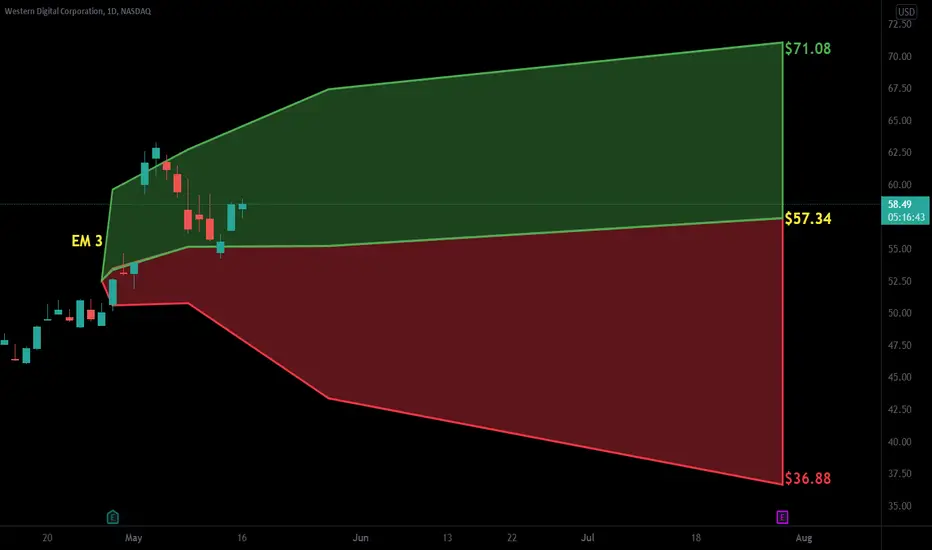
Based on historical movement, the trough could occur anywhere in the larger red box. The final targets are in the green boxes. The pending top should occur within the larger green box as has been the historical case. Half of all movement has ended in the smaller green box. In this instance, the signal indicated BUY on June 10, 2022 with a closing price of 54.66.
If this instance is successful, that means the stock should rise to at least 54.97 which is the bottom of the larger green box. Three-quarters of all successful signals have the stock rise 2.28% from the signal closing price. This percentage is the bottom of the smaller green box. Half of all successful signals have the stock rise 4.5675% which is the end point of the black dotted arrow. One-quarter of all successful signals have the stock rise 8.4275% from the signal closing price which is the top of the smaller green box. The maximum rise on record would see a move to the top of the larger green box. These are the same concepts for the levels in the red boxes as well.
The ends/vertical sides of the boxes are determined in a similar fashion. The peak of the rise can occur as soon as the next trading bar after signal close, while the max rise occurs within the limit of study at 50 trading bars after the signal. A 0.4% rise must occur over the next 50 trading bars in order to be considered a success. Three-quarters of successful movement occur after at least 10.0 trading bars; half occur within 27.0 trading bars, and one-quarter require at least 45.0 trading bars.
The black dotted arrow represents median historical movement. Medians are a good metric, but they are just one of many I use when forecasting future movement.
As always, the stock could decline the very next bar after the signal without looking back (therefore the red boxes would not come into play) or the stock may never decline (and the green boxes may never come into play).

WDC High-risk Initial LongWDC High-risk Initial Long. SL and TP on the chart. 10-20x leveraged. Move SL on TP.

$WDC Looking Good But Needs More Time$WDC not in a confirmed stage 2 uptrend so know that but it seems like a NASDAQ stock that has potentially put in a reliable bottom/base.
Something to add to your larger watchlist.
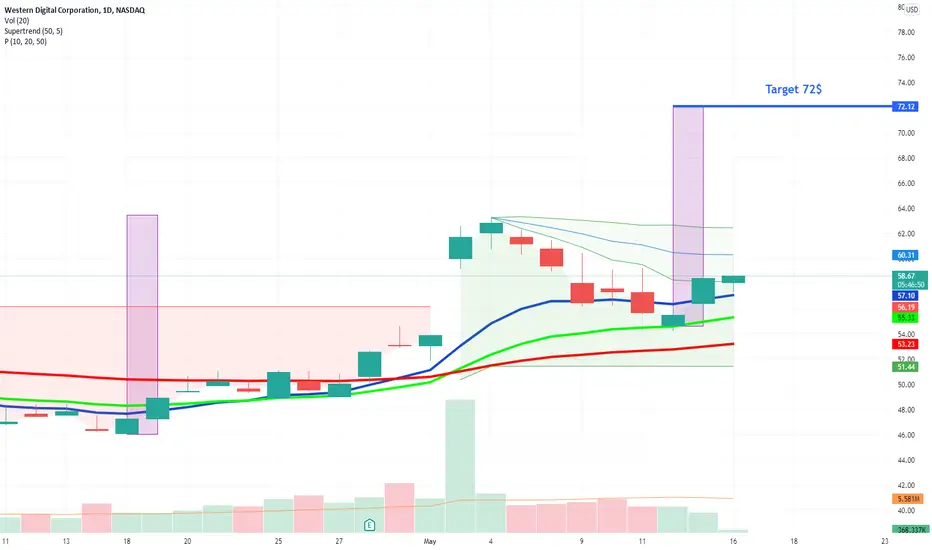
$WDC Breakout 72$$WDC Breakout in 4h Chart on volume above average after consolidation phase - Target 72$
All Entry Criteria have been met:
1. Price above 10, 20 & 50 EMA --> Check
2. Consolidation Phase in Uptrend --> Check
3. Breakout on above average Volume --> Check

$WDC with a Bullish outlook following its earnings #Stocks The PEAD projected a Bullish outlook for $WDC after a Positive over reaction following its earnings release placing the stock in drift B with an expected accuracy of 60%.
Western Digital USA Sun Storm Investment Trading Desk & NexGen Wealth Management Service Present's: SSITD & NexGen Portfolio of the Week Series
Focus: Worldwide
By Sun Storm Investment Research & NexGen Wealth Management Service
A Profit & Solutions Strategy & Research
Trading | Investment | Stocks | ETF | Mutual Funds | Crypto | Bonds | Options | Dividend | Futures |
USA | Canada | UK | Germany | France | Italy | Rest of Europe | Mexico | India
Disclaimer: Sun Storm Investment and NexGen are not registered financial advisors, so please do your own research before trading & investing anything. This is information is for only research purposes not for actual trading & investing decision.
#debadipb #profitsolutions


Good buying opportunity in WDCThis can be one of the best opportunities in the stock market for the next 3 months. I think the next target should be the $80 level.

Western Digital Is Fighting the BearsWestern Digital has skidded lower for months, but now the data-storage company seems to be fighting the bears.
The main pattern on today’s chart is the double-bottom around $49.50. Sellers hammered WDC down to that level following the last two quarterly reports, and both times they quickly retreated. That area was also a high in June 2020 and a low in December 2020-January 2021.
Second is the downward-sloping trendline beginning last June. Notice how prices have breached that line in the last few months.
Next, WDC’s series of higher lows since late January has produced a potential ascending triangle.
Fourth, MACD recently turned positive.
Finally, WDC trades for less than 10 times earnings. That could potentially help the stock at a time when investors are wary of higher valuations.
TradeStation is a pioneer in the trading industry, providing access to stocks, options, futures and cryptocurrencies. See our Overview for more.
Important Information
TradingView is not affiliated with TradeStation Securities Inc. or its affiliates. TradeStation Securities, Inc., TradeStation Crypto, Inc., and TradeStation Technologies, Inc. are each wholly owned subsidiaries of TradeStation Group, Inc., all operating, and providing products and services, under the TradeStation brand and trademark. When applying for, or purchasing, accounts, subscriptions, products and services, it is important that you know which company you will be dealing with. Please click here for further important information explaining what this means.
This content is for informational and educational purposes only. This is not a recommendation regarding any investment or investment strategy. Any opinions expressed herein are those of the author and do not represent the views or opinions of TradeStation or any of its affiliates.
Investing involves risks. Past performance, whether actual or indicated by historical tests of strategies, is no guarantee of future performance or success. There is a possibility that you may sustain a loss equal to or greater than your entire investment regardless of which asset class you trade (equities, options, futures, or digital assets); therefore, you should not invest or risk money that you cannot afford to lose. Before trading any asset class, first read the relevant risk disclosure statements on the Important Documents page, found here: www.tradestation.com .

$WDC $STX $XCHUSDT CHIAI decided to combine block analysis (the Wyckoff distribution method or "smart money" in the people) with Elliot wave analysis and got the following picture.
We are in the plane where wave B is now.
Spring 2020 was Shakeout.
At the moment, Western Digital (probably $STX Seagate) are ready to accelerate significantly (on the background of the rapid growth of CHIA?)
The maximum possible increase in $WDC - up to level 2 (201.98)
Take profit on white fibo levels, because the end of the impulse is unknown.
This paper is ready to explode at any moment (the entire growth of the current year will go into HDD mining (it hits RAM, SSD, HDD and multi-threaded processors).

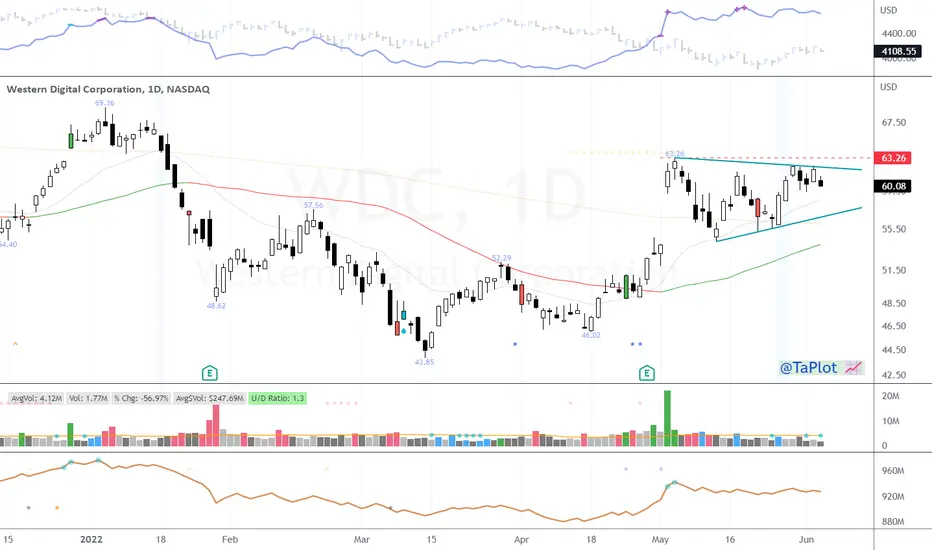
WDC LongTrendline break
Support Zone
Entry 57
Stop 54
Target 77
Risk management is much more important than a good entry point.
I am not a PRO trader.
In my trading plan, the Max Risk of each short term trade should be less than 1% of an account.

1/2/22 WDCWestern Digital Corporation ( NASDAQ:WDC )
Sector: Electronic Technology (Computer Peripherals)
Market Capitalization: 20.321B
Current Price: $65.21
Breakout price: $67.25
Buy Zone (Top/Bottom Range): $65.20-$59.90
Price Target: $71.80-$72.90 (1st), $77.00-$78.20 (2nd)
Estimated Duration to Target: 35-41d, 100-110d
Contract of Interest: $WDC 2/18/22 67.5c, $WDC 4/14/22 70c
Trade price as of publish date: $3.25/contract, $3.95/contract

WDC Base Breakout Setting Up This WDC has left its Stage 4 Breakdown
Recently has been in a Stage 1 Base
For now we are keeping an eye for a move up through $60 in time

Bad earnings, continuing downtrend...After an extremely disappointing earnings, the stock fell almost 10% in 1 day. In the next few days we quickly returned to the downtrend, which has been going on for several months. And at the moment I don't think there's any strong upside, so I think at least until the next earnings report the stock will decline further. Short @ $57-58, TP $48-40, SL $61.


WDC Seems to have found a bottomFalling Wedge on the 4H chart
+ MACD curling positive
+ Inverted Hammer and Bullish Engulfing to confirm reverse of downtrend
+ Closed above the 9EMA
+ Bullish option flow

WDC1. Around 52 it acts as a 50% fibo level
2. RSI is already showing divergence
however price can dip to 52 area and then a push higher to 60 area
3. We already see higher volumes which can be a sign of accumulation

Cup and Handle Earnings AMCWDC has earnings this afternoon and is not to long entry level. Trading at earnings can be a crap shoot )o:
Tough to buy around or at earnings day.
No recommendation
The 200 looks good and is sloping up. The 50 does not look so hot and may be trying to cross down through the 100 which would be a bearish cross.
Hard to really look at charts at earnings sometimes as things can change very fast.
I see 3 horrible red candles in purple that began with a bad wick. They are not quite 3 black crows as the bodies do not overlap, but bearish just the same. Sometimes too many red candles in a row can flush out most of the sellers so something to watch. At the bottom we see a spinning top after a small gap down which is a candle of indecision. The string of four candles (3 red, one spinning top) became less bearish because once price hit a certain level, bulls were scratching their heads about letting this go down any lower. Ultimately it did go a bit lower, but not much.
Gapping down on a doji or a spinning top can be a saving grace as gapping down is almost always bearish. Gapping down on a healthy green candle can also be a good thing. When I see a string of bearish candles that lessen in body length and/or become smaller candles like doji's or spinning tops, I watch as the bearishness can be dwindling away. This is called Deliberation and happens on the bullish side as well, or on the way up and candles become smaller or less and less bullish.
A lot depends on where the candle(s) are in the chart to decide whether they are bullish or bearish patterns or candles. Dark cloud cover is much more powerful closer to the top than at the bottom. Dark cloud cover (DCC) consists of a healthy green candle in an uptrend followed by a red candle has it's top over the green candle and closes at least mid way in to the green candle body. Since a red candle opens at the top of the Body and closes at the bottom, which is opposite of a green candle that opens at the bottom and closes at the top, this means price opened higher than the previous day and the bears were able to take price back down inside the green candle day.
The highs and lows of the session are the wicks(tops) and the tails (bottoms) for both green and red candles. Long wicks at the top, especially with little or no tail, can be a warning sign at the top but can even be bullish at the bottom. Long wicks can point to resistance as well and long tails especially at the bottom, can point to support.
No recommendation
