Elliott Wave View Expects More Downside in Exxon Mobil (XOM)Hello Traders,
Exxon Mobil (ticker: XOM) has broken below Nov 23 low ($74.7) and opens further downside in the stock with incomplete sequence from Sept 25 high ($87.36). Short Term Elliott Wave view suggests bounce to $81.97 on 12/5 high ended red wave X. Decline from there is unfolding as a double three Elliott Wave structure where black wave ((w)) ended at $74.8. Internal of wave ((w)) unfolded as another double three Elliott Wave structure of a lesser degree. Blue wave (w) of ((w)) ended at $76.92, blue wave (x) of ((w)) ended at $80.36, and blue wave (y) of ((w)) ended at $74.80.
Black wave ((x)) is in progress to correct cycle from 12/5 high as a double three Elliott Wave structure where blue wave (w) of ((x)) ended at $77.77 and can have ended blue wave (x) pullback at 75.68 low. We expect another leg higher to complete blue wave (y) of ((x)) of the double three pattern before the stock resumes lower. We expect sellers to appear and rally to fail below $81.97 in 3-7-11 swing for more downside in the stock.
XOM trade ideas


XOM- Back down to 2015 prices. Great Dividend investmentI'm always on the lookout for good dividend investments The energy sector is catching hell right now and it may be a good time to revisit some of the equities on the watch list For my dividend stocks I like to go back atleast 5 years to see trends. This may be a good time to snatch up Exxon. It has a very attractive dividend as well.

Plastic: The New TobaccoToday up for aution we have... war era industrial Crude Oil vs the 90% efficient and the downsizers
strong sell on Oil.
massive future oversupply expected and increasing money costs make oil and oil expanding ventures very weak
cannabis plastics will replace crude oil plastics eventually causing more downside for this industry
Eat organic pizza. always filter water.


Sell XOMDaily quasi bearish three/falling three method
As well bearish fakey, with gravestone doji harami pattern for the past to days...
4 hour tweezer top, to confirm bearish bias for daily short...
MACD showing negative trend patterns
Stoch heading to oversold range
Raymond James downgrade 11/20/18
ATR 1.73
S/L 79.04
T/P 74.44
R/R 1.96
Profit Trading!

Drop in XOM6 week consolidation followed by a downtrend confirmation supported by a MACD crossover suggests a further 9.28% drop by Dec 17. Bought Dec Puts.
RSI indicates there is still selling pressure and the 30 day MA has turned downward.


weekly xomthis is a walking down the hill, inside week and blood red hammer. let's see what it can do


XOM- Short swing Oil -0.21% bearish .
Looking like a classic wave structure on the wave down. Market structure on the left shows us a mirror wave up.
High risk option trades are very risky. DO not trade if you are new.

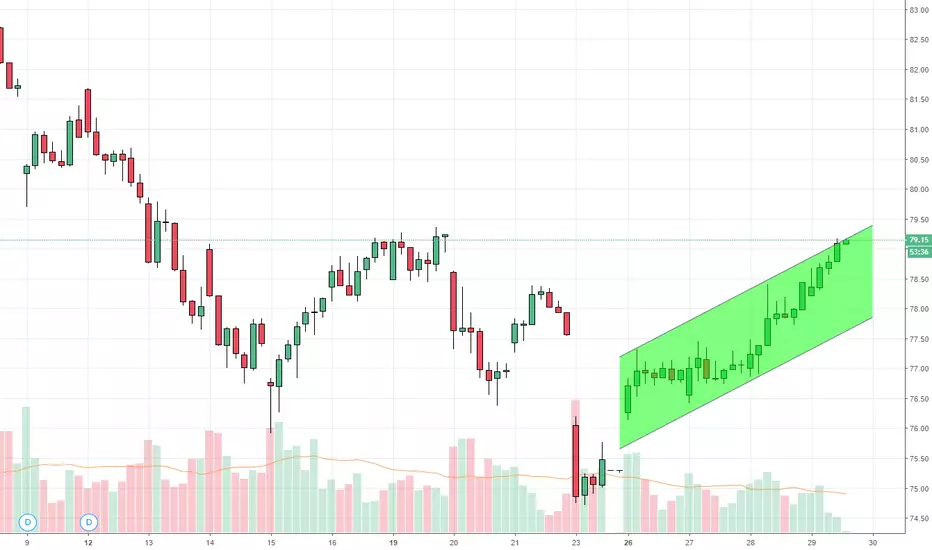
Exxon Mobil Testing Support Level as Oil Fell Last WeekExxon's stock price fell sharply last week as global market equities saw big sell-offs. During this time, oil price fell as much as 6%. This lead the stock price to test to the first major support level of the bullish channel trend.
Trade Step-ups:
Scenario One (Bullish Reversal): Price rejects a bearish breakout from the trend that span back to February. Nevertheless, it is entirely possible for price to test the next support level at around 79.00.
Scenario Two (Bearish Breakout): Price falls below channel trend, look for consolidation below 78.00.

Puts on/Short XOM Into EarningsChart scale is normal and candles are three day
XOM has been in a massive triangle formation pattern for years now and just this week it looked like it was about to break out to the upside, before it ultimately failed and the market rejected the breakout. XOM has been one of the weaker stocks in the energy sector and with higher interest rates, falling oil prices and rising steel costs, the energy sector has three major headwinds against it for the short term at least. My inclination is to buy some at the money puts expiring the week earnings are released. It is possible but I doubt XOM will go down all the way to the lower bound trendline of the triangle before earnings, so the day before earnings are released you can either close the trade, roll it down (and out) or turn it into a put spread by selling a downside put to take advantage of the heightened implied volatility, depending on your convictions on how XOM will react to the earnings release of course.
