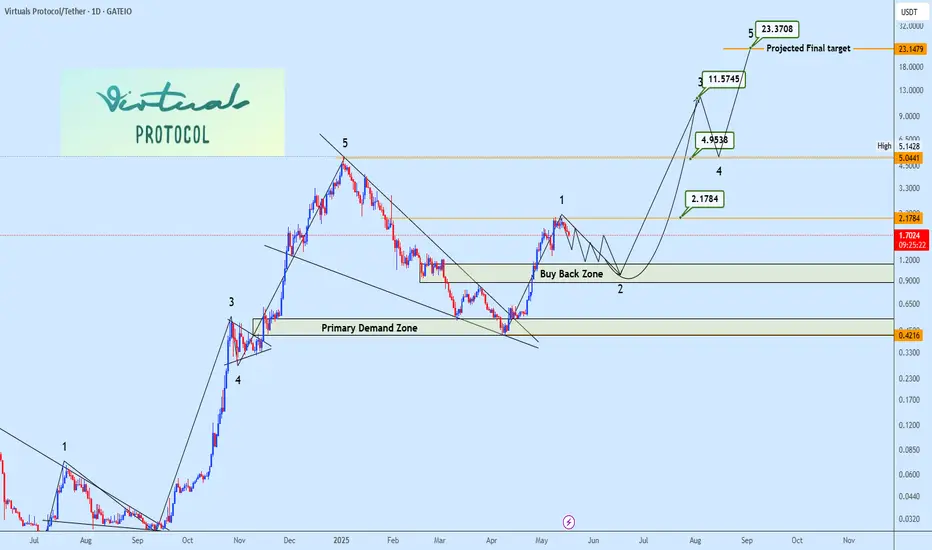
VIRTUAL PROTOCOL Wave 2 Correction in Play After 4x ImpulseFollowing the completion of its previous cycle correction, Virtual Protocol confirmed a bullish reversal via a breakout from a falling wedge, initiating Impulse Wave (1) with an impressive ~4x move. Current price action signals the commencement of Wave (2) corrective structure, aligning with standard Elliott Wave Theory post-impulsive behavior.
The buy-back zone (highlighted on chart) represents the high-probability retracement region based on Fib confluence (0.5–0.618 retracement levels) and prior structural support.
Wave (3) and Wave (5) targets are projected using Fibonacci extensions and historical momentum analogs. Eyes remain on the buy-back zone for optimal re-entry.
VIRTUALUSDT trade ideas
$FARTCOIN – Third Time's the Charm?
Back at a solid bid zone—third test of this level, so grabbing a small position here.
A move above $1.60 could trigger a push toward the range high, where I’ll look to offload some as first TP.
Let’s see how this one unfolds. MEXC:FARTCOINUSDT

VIRTUALUSDT – Is the Wedge Nearing Its End? A Breakout Could!⏳ Current Situation:
VIRTUALUSDT is approaching a crucial moment after months of sideways price action. Following a steep decline from its all-time high ($5.25), price action has formed a Falling Wedge pattern — a well-known bullish reversal formation.
Now, as price consolidates toward the wedge's apex, the potential for a breakout grows stronger with each passing day.
---
📌 Pattern Structure:
Pattern: Falling Wedge (Bullish Reversal)
Duration: Since May 2025 (multi-month)
Support line: Ascending slope, catching lower dips
Resistance line: Descending pressure trendline
Price action: Trapped inside the wedge, signaling accumulation and shrinking volatility
This structure suggests that a large move may be right around the corner.
---
🔼 Bullish Scenario (Breakout):
If VIRTUALUSDT successfully breaks above the upper wedge boundary (~$1.70), the following key resistance levels could become major bullish targets:
1. $2.08 – Initial breakout confirmation level
2. $2.45 – Key resistance zone; breakout could accelerate here
3. $3.76 – Strong historical supply area
4. $4.62 – Major previous resistance
5. $5.25 (ATH) – Long-term bullish target if strong momentum follows
💡 Tip: A volume spike on the breakout adds confirmation and reduces the risk of a false breakout.
---
🔽 Bearish Scenario (Breakdown):
If the price fails to break out and instead falls below the wedge support (~$1.40):
1. Look for support near $1.20 – $1.10
2. Further downside could lead to $0.70 – $0.50
3. The ultimate support lies around $0.41, the current all-time low
⚠️ Note: A breakdown without volume can be a fakeout. Always wait for confirmation.
---
🎯 Conclusion & Strategy:
> VIRTUALUSDT is coiling inside a falling wedge pattern — typically a prelude to an explosive move. Whether bullish or bearish, the breakout direction will offer a strong trading opportunity.
Suggested Strategy:
Watch for breakout + volume confirmation before entering
Place tight stop-loss below wedge support if buying the breakout
Set tiered take-profits based on horizontal resistance zones
#VIRTUALUSDT #AltcoinBreakout #FallingWedgePattern #CryptoSetup #BullishReversal #BreakoutWatch #AltcoinAnalysis #CryptoTechnical #VolumeBreakout

VIRTUAL/USDT – Rebound Incoming or Deeper Collapse?🔍 Overview: Bearish Pressure, But Structure Holds
VIRTUAL/USDT is currently consolidating within a well-defined Descending Channel pattern that has been forming since early May 2025. While the trend is bearish, price action remains within a controlled structure — a potential sign of hidden accumulation or smart-money positioning.
What makes this setup compelling is that price has just touched the lower boundary of the channel while also interacting with a historical demand zone around 1.20–1.25 USDT, which previously triggered a strong rally back in May.
---
🧠 Key Technical Pattern: Descending Channel + Historical Demand Zone
Descending Channel → Suggests consistent selling pressure but within a structured range — no real breakdown yet.
Demand Zone (1.20 – 1.25 USDT) → A historically strong support level that has launched sharp upward moves in the past.
Decreasing Volume → Could indicate weakening bearish momentum as price approaches key support.
---
📈 Bullish Scenario (Bounce from Support):
If the price manages to hold and forms a reversal signal (such as a bullish engulfing or hammer candle), we could see a relief rally toward key resistance levels.
🎯 Potential Bullish Targets:
1. 1.6787 USDT – Mid-channel resistance
2. 1.9000 USDT – Psychological and structural resistance
3. 2.0848 – 2.4571 USDT – Horizontal resistance zone and top of the channel
4. 3.7620 – 4.6267 USDT – Extended targets if breakout occurs with volume
📌 Bullish Confirmation Needed: A strong breakout above the channel midpoint + increasing volume to confirm a potential trend reversal.
---
📉 Bearish Scenario (Breakdown from Channel):
If the price fails to hold above the 1.20–1.25 support and breaks below the channel support, we may see increased selling pressure and a continuation of the downtrend.
🎯 Downside Targets:
1.00 USDT – Psychological support
0.90 – 0.70 USDT – Previous accumulation range
0.4110 USDT – All-time low and ultimate downside target
🚨 A strong breakdown with high volume could trigger panic selling and a prolonged bearish leg.
---
🎯 Conclusion:
> VIRTUAL/USDT is at a pivotal decision point — hold and bounce, or break and slide.
The structure is still intact, and the price is testing two critical technical zones simultaneously: the descending channel support and a major demand area.
This is not the time to chase price, but to observe and prepare for confirmation. A strong signal here could set the tone for the next major move.
#VirtualUSDT #CryptoTechnicalAnalysis #DescendingChannel #DemandZone #ReversalSignal #AltcoinAnalysis #CryptoTradingSetup #PriceActionTrading #SupportResistance

virtual Trade Planhuge wave 1 completion towards the upside making 5 wave of wave 1 complete and now wave 2 is now it's ending Traders can enter this coin slowly for an explosive wave 3 towards ATH
the whole 5 wave target is around 12.62$ making this trade a solid 12 RR

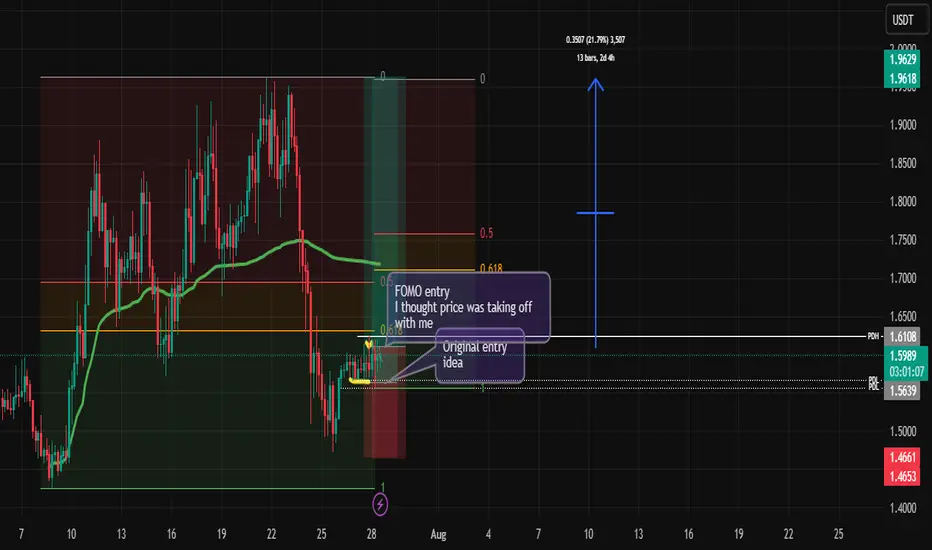
Virtual FOMO and a 20%%????
Like all the others, I am looking for a pump on virtual to grow that spot.
If look closely, I fomo in.
Let's see what happens in by the end of the week.
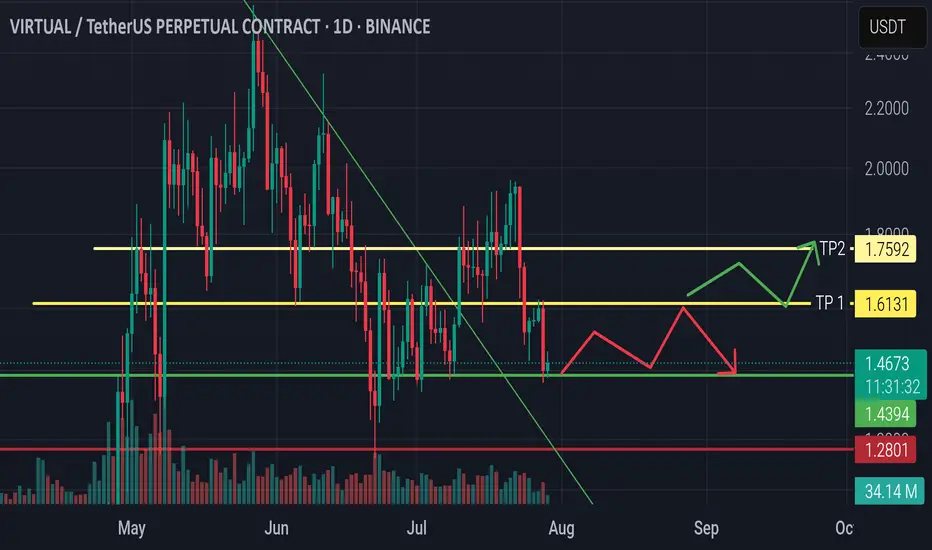
VIRTUAL/USDT – Daily Technical AnalysisThe current price is 1.4578 USDT, showing a slight increase of +0.52%. Here’s what we’re watching:
✅ Potential Entry Point: Near the previous support level at 1.2801 USDT.
🎯 Target Levels: ▪ TP1: 1.6131 ▪ TP2: 1.7592
🔄 Expected Scenarios: If the price holds above the support level, an upward move is anticipated (green path). In case of a drop, a corrective move could follow (red path).
📊 Volume remains steady, and technical indicators suggest a bullish outlook—provided the next resistance is breached.
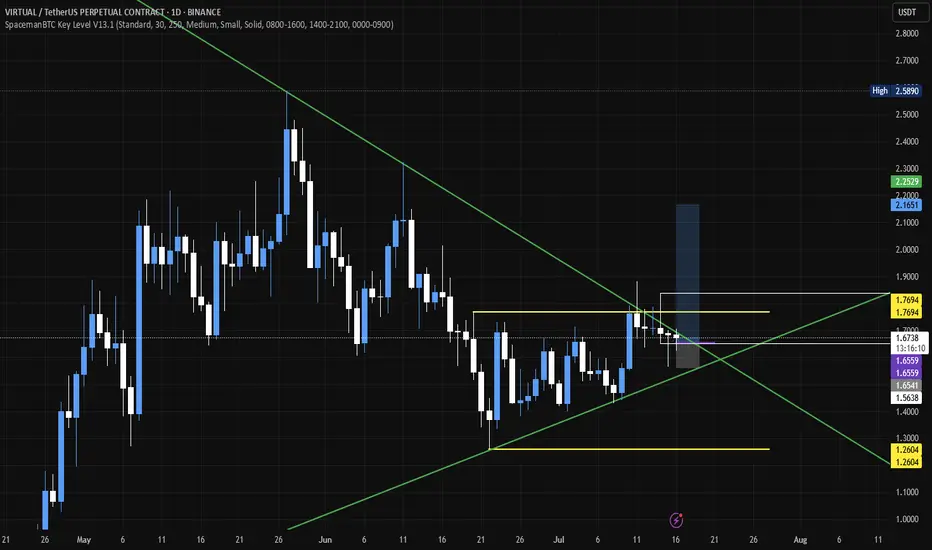
VIRTUAL – Major Confluence ZoneEntry into 3D S/R and Demand Zone (Blue Box)
The current price action is testing a key 3D support/resistance level, which aligns with a historical demand zone.
Multiple diagonal supports converge here, making it a high-probability zone for a reaction.
Accumulation & Reversal Play
The setup suggests that this zone is ideal for building a position.
Expect potential wicks/spikes into the lower blue zone, hunting liquidity before a reversal.
If price holds above ~$1.40 (blue line), look for signs of strength (bullish candles, reclaim of lost support).
Upside Targets
If the zone holds, the first target is the prior local highs ($2.00–2.05).
Further targets are the overhead supply zones (highlighted in red), especially if the momentum persists.
Invalidation
A daily close below $1.40 or sustained trading below the lower blue box invalidates the setup and signals a risk-off environment.

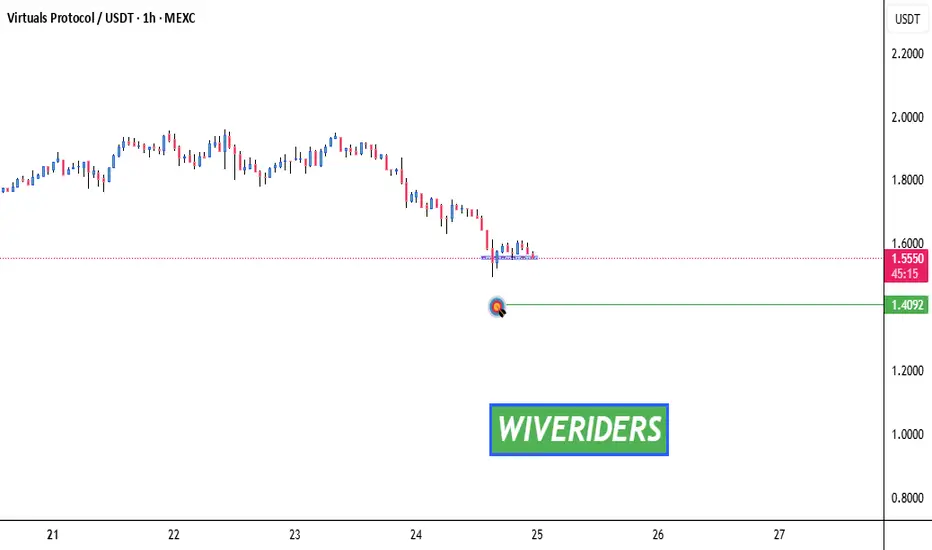
Testing Blue Support – Key Level Ahead!🚨 SPARKS:VIRTUAL Testing Blue Support – Key Level Ahead! 📉🔵
SPARKS:VIRTUAL is currently testing the blue support zone.
📊 If a breakdown occurs, we could see a move toward the green line level as the next target.
🛑 Watch for confirmation — this could signal further downside if sellers take control.
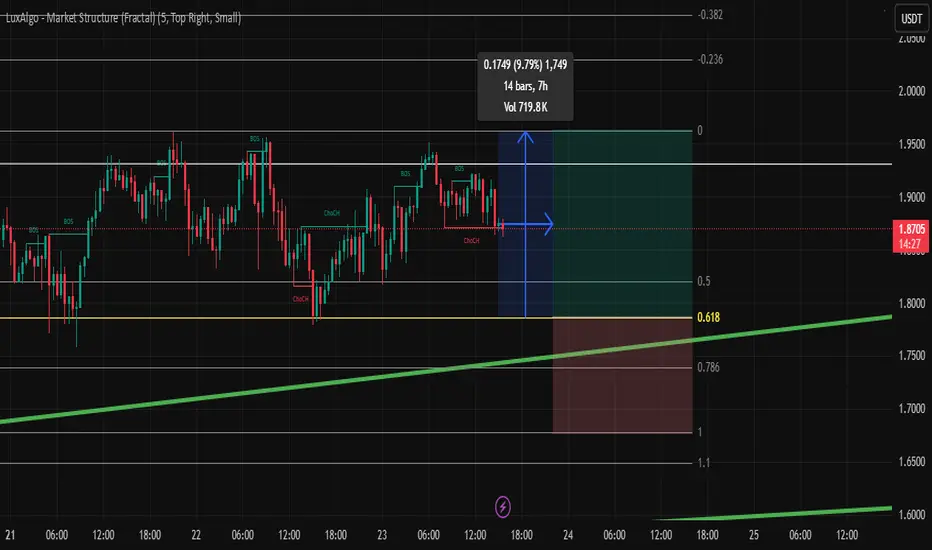
Virtual LongWill London or NY bring Virtual to me at .618, 10PM-Midnight - My trading window?
If it happens, I won't look at any other pairs.
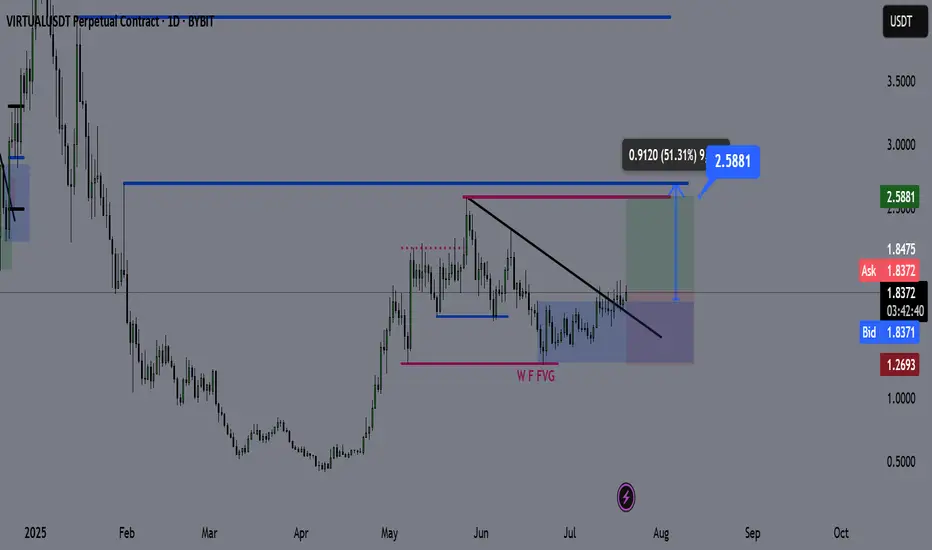
Virtual Coin – Technical Outlook & Trade Plan🔍 Technical Analysis
✅ Price has broken and closed above the bearish trendline, indicating a shift in market structure.
✅ It’s currently consolidating above the trendline, and each retest is showing strong bullish reactions.
✅ The bullish daily demand zone is holding aggressively, reinforcing upward momentum.
I do not expect a significant retracement from here until we reach the purple line (2.59). The current structure suggests price wants to seek higher liquidity.
📌 Trade Plan
Entry: Current market (above trendline + demand zone reaction)
Take Profit (TP): 2.59 (Purple Line)
Stop Loss (SL): 1.26 (Daily Close Below)
📊 Bias: Bullish
🕰️ Timeframe: Daily
📍 Invalidation: Daily close below the demand zone and trendline support
💬 Feel free to share your thoughts or ask questions below!
VIRTUAL LONG IDEA Virtual Long Idea, momentum of ETH is strong and virtual as beta of ETH, might breakout and make good gains
VIRTUAL — Clean MSS+BOS Flip Long | #1D | BULLISH1. Limit order on retest S/R flip (1.65–1.68)
2. Entry after confirmed hold above support
3. Main target: 2.18
4. Stop: Below 1.49

VIRTUALUSDT 12HKeep an eye on the #VIRTUAL 12H timeframe chart. In case of a breakout above the descending resistance and the 12H SMA50, the targets are:
🎯 $1.7682
🎯 $1.9249
🎯 $2.0816
🎯 $2.3048
⚠️ As always, use a tight stop-loss and apply proper risk management.

VIRTUAL – Setting Up for a July Breakout - $4 in the Horizon!
Another coin worth bidding on: $VIRTUAL.
It's setting up nicely above the mid-range of the current trading range, with a clean S/R flip off the previous cluster zone.
The 3-day MA is holding well, and the downtrend from the local highs is set to expire on July 6th.
Expecting a strong trend to kick in during the second week of July, with potential to push toward the $4 mark.

VIRTUALUSD WILL BE GO TO MOON On the VirtualUSDT side, most coins are locked, and I’m expecting an increase in price due to the potential of a major project presale.
Hopefully, it works out and you all profit from it.
I’m aiming to generate short-term gains.

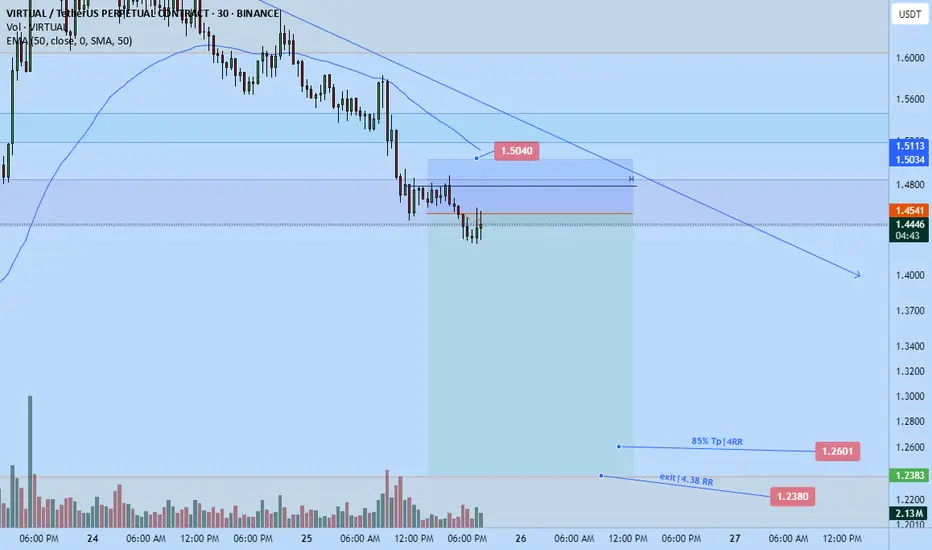
Virtualusdt big shortBig short on Virtualusdt. Just opened it. Roughly 4.38rr. Market looks likely to dump hard. The market started to trend down already as you can see, I expect continuation tonight leading into tomorrow morning
DTT strategy applied- Direction target and timing. It's a topdown analysis approach starting from the monthly and working your way down to the 15 minute tf for alignment
Trade is roughly 4 RR from current entry.
Time sensitive.
Bullish Flag Breakout on VIRTUAL/USDT – Targeting 20%+ Gain! Bullish Flag Breakout on VIRTUAL/USDT – Targeting 20%+ Gain!
After a strong bullish rally, VIRTUAL/USDT is now forming a textbook bullish flag — a continuation pattern that signals potential for another leg upward.
Trend: Clearly bullish on recent impulse
Pattern: Flag forming as a downward-sloping consolidation channel
Volume: Strong volume during impulse, lighter volume during consolidation – perfect textbook setup
Structure: Higher highs and higher lows intact
VIRTUALUSDT #BullishFlag #CryptoBreakout #TechnicalAnalysis #AltcoinSetup #TradingStrategy #CryptoChart #PriceAction #TrendContinuation #SwingTrade #TradingView

Virtualusdt dump continues to $1.655Just recently opened a short position on virtualusdt. Anticipating dump continuation down to $1.6550 today maybe lower.
Looking to take partials along the way.
Tp 1: $1.7045...50% tp or full close depending on price action
Tp 2: $1.6550
Time sensitive, breaking down rn.

VIRTUALUSDT Perpetual – Breakout Long Setup from ConsolidationVIRTUALUSDT has shown signs of accumulation with a series of higher lows followed by a breakout above the local resistance zone around $1.8398, suggesting the potential start of a bullish leg.
Trade Details:
Position: Long
Entry: $1.8398
Stop Loss: $1.7683
Take Profit: $2.0858
Setup Type: Breakout from Range / Early Trend Continuation
Setup Rationale:
Market broke above consolidation range, triggering a long opportunity
Clear bullish momentum supported by consecutive higher lows
Favorable risk/reward ratio for swing or short-term continuation traders
Target aligns with previous resistance zone above $2.08
This setup anticipates a continuation move to the upside following the breakout, with a well-defined stop below the previous swing low.

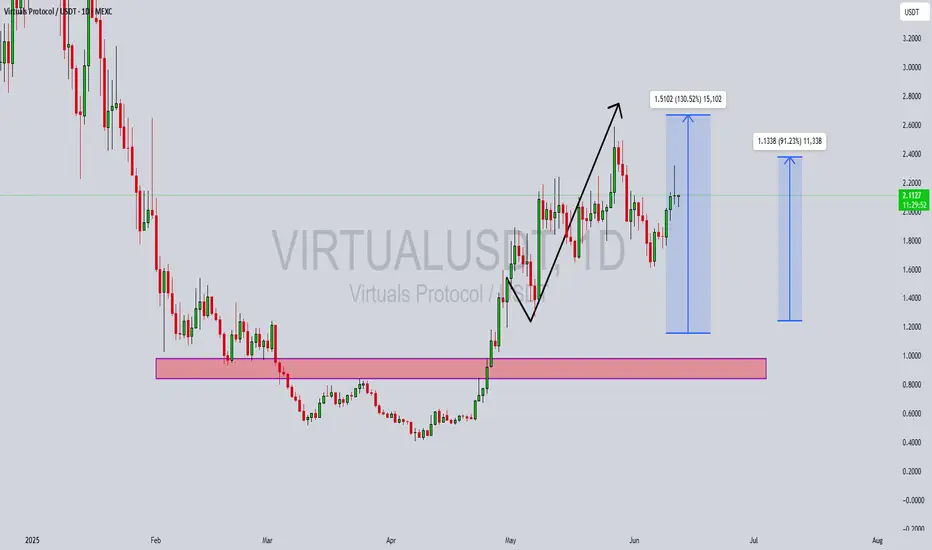
VIRTUALUSDT Forming BullishVIRTUALUSDT is showcasing a powerful bullish structure after a prolonged accumulation phase near the $0.80 to $1.00 support zone. The breakout from this accumulation base has resulted in a parabolic move, confirming a strong shift in trend. Currently, the pair is forming a bullish continuation pattern, with high volume inflows suggesting increasing investor confidence. The recent consolidation above previous resistance is a positive signal for trend continuation, and technical targets show potential for a 120% to 130% upside in the coming sessions.
The setup aligns with classic market psychology, where a strong move is often followed by a period of profit-taking before the next leg higher. The technical projection zones around $2.60 to $3.00 are realistic based on the depth of the prior impulse move. Furthermore, VIRTUALUSDT is gaining traction in the DeFi and virtual asset space, with its protocol generating buzz in 2025's altcoin resurgence. This combination of narrative and chart structure makes it a potential top mover.
From a risk-reward perspective, this pair presents a favorable long entry with minimal downside if stop losses are positioned just below recent swing lows. As the broader market recovers, strong technicals like these could deliver amplified gains compared to average tokens. It's worth noting that smart money often positions itself before explosive runs—and this chart suggests accumulation has already occurred.
Investors and swing traders should keep this pair on their radar as it continues to carve higher highs and higher lows. If momentum persists, VIRTUALUSDT could become one of the standout performers in the altcoin space this quarter.
✅ Show your support by hitting the like button and
✅ Leaving a comment below! (What is You opinion about this Coin)
Your feedback and engagement keep me inspired to share more insightful market analysis with you!
Virtual usdt scalp long to $2.06Just now entered this trade.
Stop: $1.8557
Tp: $2.06
Roughly 2 RR for me
Pa suggest higher prices based on my DTT analysis. Plus there is some fundamental news about this token recently which can help drive demand

Update on VirtualNow we need to break above the red line to form a BOS and then I will look for an OB or FVG on the 15m timeframe as my confirmation entry.
You may market enter now as you wish but not more than 0.25% of capital.
