virtuals breaking up from a symmetrical triangle w/a 3x + trgtIf this pattern validates its breakout, the measured move target from here is over 3x. *not financial advice*
VIRTUALWETH_9C087E.USD trade ideas

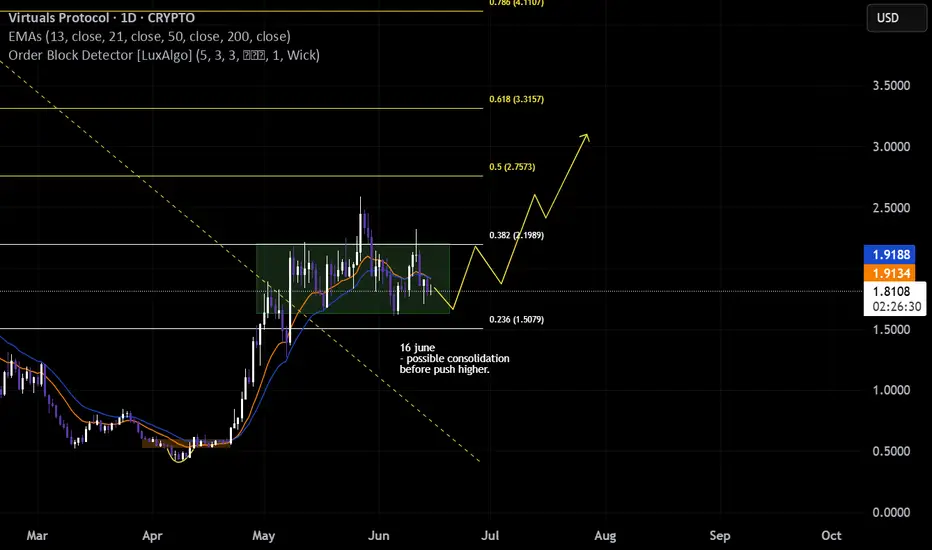
VIRTUAL LONG- Possible consolidation in fibs area before push higher.
- Price is at the demand area.
- good PA performance so far when btc got the rally
- when btc rally, this might have a good push
Possible BO retest- structure bullish, respect 13ema
- ascending triangle pattern bo retest.
- btc price still holding.
- possible stoch cross

The return of the ICO. AI Style?Virtuals Genesis Launches is one of the most interesting things I have seen in a long time. The Virgen points system is really well done. Allowing projects to both raise the starting capital they want as well as getting a lot of smaller holders that can be early users/promoters. All the attention Virtuals got previously was from the Prototype Agents setup. That setup is honestly kind of garbage. My goal is to farm points and get small exposure to a lot of AI start-up ideas. Many of these will fail but a lot of them are really trying to build something interesting. Unlike IPO's it allows small investors to back projects early. Typically the range seems to be 0.01 to 566 Virtual. That's roughly 2 cents to $1132.
Found support above 34 EMA around $1.80.
MACD is trending down on the daily chart now.
RSI is heading down.
STOCH RSI is also not showing anything bullish currently.
Though I am holding spot Virtuals, there is a lot of evidence to show price could go down here. There is currently not a lot of great news for bulls.
Disclaimer: The information provided in this post is for educational and informational purposes only. It does not constitute financial advice, investment recommendations, or a solicitation to buy or sell any financial instruments. All investments involve risk, and the past performance of a security, market, or trading strategy does not guarantee future results. I am not a financial advisor. Please conduct your own thorough research and consult with a qualified financial professional before making any investment decisions. You are solely responsible for any investment decisions you make.

Virtuals Protocol (VIRTUAL/USDT) Price Heading towards new ATHThe daily chart of VIRTUAL suggests the price has triggered a parabolic recovery and may follow the curve to rise and reach the neckline. After securing the range above the 50-day MA, the price has surged above the 200-day MA, which could further head towards a Golden Cross. On the other hand, the RSI has surged and entered the overbought range for the first time in 2025, validating the bullish claim. Therefore, the VIRTUAL price is believed to maintain a strong ascending trend and rise above the crucial resistance at $1.84 in a short while.
Resistance 1: $1.84
Resistance 2: $2.99
However, the price is required to surpass the crucial resistance zone between $3.8 and $3.9, which could push the price above $5 to form a new ATH somewhere around $6.5

VIRTUAL at Bottom? Time to Buy?SPARKS:VIRTUAL www.tradingview.com has double bottomed at around 1.85 after rocketing to $5. Is it time.to buy the dip or is it a pump and dump?
Well on top of a couple bullish signals, just recently, Virtuals Protocol has expanded to Solana, leveraging its speed, scalability, and community to enhance its platform. They've introduced the Meteora Pool with new trading pairs and opportunities and established a Strategic SOL Reserve (SSR), allocating 1% of transaction fees in SOL to reward creators and agents. Aligning with their mission to drive AI innovation in decentralized platforms, Virtuals Protocol continues to grow. Additionally, Upbit has listed VIRTUAL with KRW, BTC, and USDT trading pairs, further increasing accessibility. Not to mention other channels are now starting to cover VIRTUAL! It's about time!
If Virtuals Protocol can continue to move forward, innovate and scale at this momentum, bullish price action is inevitable. Is it time to buy the dip? There may be better buying opportunities still to come but as long as no black swans crap in the pond, we may be pretty close to a bottom.

Not the time to buy the dip! Wait to buy the strength!!! I just published my article on ai16z and my thoughts on Virtual is very similar to ai16z.
The current chart set up for Virtual is pretty ominous, however, I am still bullish on Virtual.
The new US president just came into the office and also his (and the rest of his family) meme sucked all the liquidity out of the rest of the crypto market. The market is very volatile and it is hard to do technical analysis at the moment.
The one thing I can say is that it is not the time to be hopeful and keep buying every dip to add to your position. I haven’t sold any of my Virtual because I don’t trade with leverage. And my allocation for this asset is small. However, once Trump meme mania settles and the liquidity starts to flow back to the rest of the crypto market, I will start to look for an opportunity to buy more. However, I will not buy the dip: I will buy the strength!!
What I mean by buying the strength is I will only buy when the momentum for the bull clearly comes back. I won't try to buy just because the price is cheap.
I usually use two time frames - daily and 4h. I will wait until the daily stochastic resets and start to roll back to 50 and the 4H MACD lines properly cross and enter the bull zone (above 0).
Also, I am waiting to see if 4H candle can move and close above $2.92 area at Fib 0.236, which gives me an idea if the momentum is strong enough to start to move up.

BUY - take off after consolidation? Virtual protocol completed a strong correction from $5.1 to $2.2. The price fell to the key Fib zone (Blue Fib line in the chart) bounced up with a strong bullish candle formation in the 4H chart.
The price broke and closed above the descending parallel channel as well as Fib 0.236 (orange Fib line in the chart). As I mentioned in my last article, when the price breaks above Fib 0.236, there is a good probability it continues to move to Fib 0.5-0.618 area. If it only reaches 0.382 and retraced back down, it usually means that it is a continuation of the bear trend (at least in my past observation.)
In this case, the price shot up to Fib 0.618 but now it is pulling back. Given that there are two layers of sell blocks sitting above the Fib 0.618 area, there is no surprise the price is coming now.
All momentum indicators in the 4H chart have reached the overbought territory and are moving downwards. However, both Daily and 4H MACD are way above 0, so I interpret it as the dominant trend is bullish but it is a correction phase.
If the price is going to move in the classic style, I anticipate it is likely to oscillate between $3-$4 range. And once the 4H momentum indicators reset and start to move upwards, it is going to start another leg up to and beyond the previous ATH.
There are many "IF". It all depends on when Bitcoin decides its decisive move. But my overall bias for Virtual and crypto market in general is very bullish.
I have been holding Virtual last year (purchase price is about $0.50) and I haven't sold any. I might start taking profit in stages when the daily MACD or RSI starts to form a clear negative divergence.

BUYWell, I was hoping the price would consolidate for a while when it broke above the trendline and Fib 0.236, but it blasted off to Fib 0.618, instead. Last nights CPI data must have been a major catalyst for this move.
I have bought Virtual at around $0.50 Nov last year and I haven't sold any yet. I am bullish on Virtual and I intend to invest and hold for a while, instead of trading.
I am looking for an entry to buy more. I personally don't think it matters too much to buy it for $4 , $3.80. or $3.50 IF you are to hold it for several months. However, currently the price is hovering around Fib 0.618 which is the area the price often corrects temporarily. Also, two sets of sell orders sitting right above it. The 4H Stochastics has already reached the overbought territory (although it doesn't mean much when the momentum is very strong. It can stay in the overbought territory for a long long time and the price keeps going up.)
What I am going to do is to wait and see how the price will settle during Asian and European a.m. sessions. If the price comes down to Fib 0.382-0.5 level, I will buy more.

Buy if these conditions are metI am going to buy when the following conditions are met:
1) Daily stochastics (9,3,3) reset and start to move upwards
2) Daily MACD remains above 0 level (bull zone)
3) 4H MACD lines cross and enter the bull zone.
4) 4H stochastics are not overbought territory (it is okay if the conditions above are met but it might experience a few more pull backs if stochastics are overbought)
5) 4H candle breaks and closes above the top descending parallel channel and stays and also it is above Fib 0.236.
There are a lot of conditions to meet and it might take a while, but from my past experiences, when these conditions are met, the price start to move smoothly in the direction of my bias. I don't need to go through unnecessary emotional roller coaster.

Virtual Protocol - don't get trapped! Last night (morning in NY), Bitcoin went above $100k and it looked like the crypto market was about to start a bull trend. For Virtual, the 4h candle decisively broke and closed above the previous week's mid price and previous month's high price. Stochastic and RSI lines both crossed and went into the bull zone. MACD lines looked like they were about to cross in the bull zone. Everything looked quite bullish and promising. I was almost tempted to open a long position, but I didn't. The price ended up retracing and it is now below the recent support area.
What saves me every time in the chart setting like this is to wait for MACD lines to cross properly. I got caught in so many bear/bull traps like this because I wasn't patient enough to wait for MACD to cross. It is a very simple strategy but extremely effective.
I am still very bullish on Vertical and wait for re-entry. However, I will wait for 4H MACD to cross in the bull zone and for daily stochastic to cross and roll back before I consider adding more position.

Virtuals Protocol in Freefall Mode, Bounce Next?Virtuals Protocol www.tradingview.com has been in freefall since it cracked $5 a week ago. The good news? Currently Virtual is at $2.70, slowing down for a pit stop at a key support - the 50% Fibonacci retracement level. A strong bounce here (we would want to climb back up past $3) could mean the bulls have taken back control and we might be in for an exciting reversal! If that doesn't happen and the baby bears come correct $2.15 is the next key support level to keep an eye on. Do you think we'll get a second wave? Let us know if you are buying the dip!
.............
New video dropping today!
Follow us for more timely technicals updates!

Virtual protocol - patiently waiting for this correction to endMy overall bias for VirtualProtocol is very bullish. I personally don't think Bitcoin macro bull cycle hasn't peaked so I am interpreting the current move of Virtual as the first major correction. Therefore, I am patiently waiting for the set up to buy.
When I analyse the chart, I usually use two time frames. For more mature assets like Bitcoin/Ethereum/Solana, I use weekly chart and daily chart. But young assets like Virtual, I use daily chart to engage the overall environment of the asset (bull market or bear market) and use 4H to identify an entry point. The processes I am using as follows:
1) Look at the daily chart - if MACD lines are clearly above 0 line, it is the bull trend. If MACD lines are pointing downwards, it is just going through temporary correction as long as lines are in the bull territory. Currently, MACD lines are clearly pointing downwards but still above 0. Therefore, I assume it is a temporary correction. The price is sharply dropping, but the bull trend hasn't been negated yet.
2) Look at the daily stochastic (9,3,3) - Daily stochastic reacts much faster than MACD. When daily stochastic lines cross and start to roll upwards, it signals it is almost ready for me to buy in the 4H chart.
3) Look at 4H chart - make sure daily MACD is in the bull terriroty and daily stochastic is moving up. 4H MACD needs to properly cross, point upwards and enter the bull territory . When that happens, 4H stochastic is still not in the overbought territory. If it is, the price can retrace one more time.
There are many conditions that need to be met, but when I follow these rules it removes a lot of market noises, which helps me from suffering mental anguish.
In short, Virtual is no way ready to recover from this correction. Until Bitcoin decides what it wants to do, the rest of the crypto will continue to suffer.

Virtual Protocol - low is in yet? Virtual is currently going through a major correction. After it broke below the previous week mid/the previous month high, it accelerated the downward move in the narrow descending parallel channel. Today, the price hit the previous week low at $3.35 which is the previous major support/resistance level. Is the low in? I think it all comes to Bitcoin's next move.
My general bias for Virtual is bullish. So I am patiently looking for an entry to buy. Price is the king but I find momentum indicators , MACD in particular, extremely useful to identify a good entry area.
I am going to consider a re-entry when:
1) the price breaks and closes above the top descending parallel channel in the price chart;
2) MACD and RSI lines move above the descending trendline and enter the bull territory;
3) Stochastic in 4H chart is not overbought territory; and
4) For the final confirmation, stochastic in Daily chart has crossed pointing upwards.

VIRTUAL: AI AGENTSVIRTUAL made a significant run in the last few months with rising more than 10,000%!
The AI Agents run is ending soon, so buying now is not recommended.

Virtuals Protocol Entry OpportunityVirtuals Protocol is approaching 1st level of support around .38 Fib and trendline. Look at entry position in the 0.30-0.33 zone.

Virtual protocol - waiting for re entry The price dropped below the previous week mid and the previous monthly high. Currently the price is hovering over EMA55 and Fib 0.618. MACD lines are widely apart and diving into the bear territory so the price correction is still in progress. However, 1H momentum indicators are starting to form positive divergence and moving its way out of overbought territory. I will continue to focus on the 4H chart. If Virtual continues its bull trend, I anticipate the price will start to move upwards somewhere between Fib 05 and Fib 0.786 level (between previous week mid and low area). MACD has been very reliable indicator for me to enter the market. I will wait for MACD lines to cross and move upwards.
Bitcoin is going through a temporary correction so overall cryptomarket might be affected by it.

Virtual protocol - wait for a re-entry
Daily RSI had been forming clear negative divergence since 30th Nov. The price broke the previous month high and daily candles formed the bearish engulfing pattern after. In the scenario like this, I usually close a trade or take a partial profit. However, Virtual is one of the most sought after infrastructure AI tokens, therefore, I need to take fundamentals into consideration. I am anticipating the price will resume another leg up, although it might go through some correction or sideway moves first. Instead of taking a short position, I am looking for a re-entry position. As of today, the price has dropped to the previous month high at $4.0 and the price is holding above that level. In the 4H chart, MACD and RSI are moving downwards but still remain in the bull zone. Stochastic (9,3,3) on the other hand has already reached oversold territory and entered into the bull zone.
I will update the analysis on this chart in a day or two. But I think a good entry for long will eventually appear. I definitely won't go short for a strong asset like this, not matter how aggressively pulling down.

VIRTUAL Protocol Lands on Moon! $5 Party Incomingwww.tradingview.com Virtual Protocol : $5 Party or Rugged by 4 Cents?
Virtual Protocol just tapped $4.96 earlier today, leaving us all wondering—are we on the verge of a $5 party, or did we just get shorted 4 cents? For all the degens and diamond hands out there, the Fibonacci extension from the previous low to high has Virtual targeting $5.32. That’s right, the crypto gods are speaking, and they’re whispering “come to me moon boy”
But let’s not break out the champagne candles just yet. This rocket has plenty of fuel left, but watch for some turbulence as FOMO kicks in harder than a bull on a bear's back. The charts are lit, sentiment’s running wild, and you don’t want to be caught paper-handing when the resistance radar starts blinking.
So what’s next? If we smash through $5 like it’s a piñata at the stonk party, that $5.32 target isn’t just realistic—it’s inevitable. But if the bears crawl out of their baby bear caves and try to drag us down, don’t forget: Virtual Protocol doesn’t just dip, it invites the big players to buy in. ***But just to be candid I did take some profits off the table in case the party ends early, but I'm not closing this position yet. It's been a 🚀 of a ride, see you on the moon!
Get your popcorn, keep an eye on the candles, and let’s see if Virtual becomes the life of the $5 party or just another sob story for the SMP Bagholder Detector (indicator). Either way, we’re in for a ride.

Virtual Protocol - long opportunity after temporary correction
The price started to break below the ascending wedge in 4H chart. The price also broke below the previous higher high at $3.5389 and closed. MACD , RSI, and Stochastic are in the bull territory but stochastic and RSI are forming negative divergence. Virtual Protocol is one of the strongest project in this crypto cycle so I am not opening a leverage short position. However, I took a small profit at $3.50. I intend to add more to my existing holding and for that I am waiting for the price to clearly fall below the bottom ascending trend line. I drew the Fib retracement li from $2.2392 to $3.7294 . Based on that, 0.5 retracement level falls to the previous week mid price level. 0.618 level is where the big buyer block is sitting. So I will keep an eye on that zone and if the price starts to go up and also all momentum indicators start to point upwards without going into oversold territory, I will buy more.

Virtual Protocol Retests All Time High!With the recent crypto crash leaving portfolios looking like a deflated balloon, it’s refreshing to see a winner like VIRTUAL www.tradingview.com stepping up! When the market hit rock bottom, VIRTUAL dipped to $2, which we flagged way back when in our last video. (What’s better than hindsight? Fore-sight!)
I loaded up big—swapping all my BTC for VIRTUAL at $2.40 and $2.00. Yeah, some called it bold, others called it reckless. I call it profitable.
Now, here’s the exciting part: $3.20 is our key resistance level. Break that, and we’re not just going to the moon—we’re talking intergalactic travel, baby! 🚀
Why $3.20? This level has acted as a ceiling in previous rallies, and if we can crack it, the next stop could be $5 or higher in a bull market. Picture this: your portfolio in a bull run with VIRTUAL riding the wave like a pro surfer. Let’s just say, I’m already daydreaming about what to name my private island.
So, buckle up—whether we’re heading to the moon or just the next stop, VIRTUAL is proving it’s got the legs for the race.
(Disclaimer: If this tanks, I'm going to be homeless!)

VIRTUAL Protocol to the Moon? Next Stop $5Virtuals Protocol (VIRTUAL) has recently hit an all-time high at around 3.13 usd, showing significant momentum. Given its current price surge and market behavior, there are a few key factors to consider for price discovery:
1. Overbought Conditions: VIRTUAL is currently showing signs of being overbought, with the Relative Strength Index (RSI) reaching levels above 70, which typically signals a potential for correction. However, if buying pressure continues, the price could keep rising, as it has been in overbought territory in the recent past and pushed through to new ath's.
2. Resistance and Support Levels: Looking ahead, VIRTUAL's next potential resistance levels could be around $5 aligning with the 161.8 Fibonacci extension level depending on market sentiment and continued buying. Support levels are currently around $2.46 aligning eith the 78.6 fib retracement level and $2 beneath that, with the real possibility of testing lower levels if a correction occurs.
3. Market Trends: The price is still experiencing significant bullish momentum, and if the rising wedge pattern holds, a breakout could push VIRTUAL beyond its current levels. However, it's important to monitor for any signs of a reversal, as price corrections could be imminent.
In summary, while VIRTUAL is in a strong uptrend, be prepared for potential volatility and corrections. Keep an eye on support levels and market indicators like RSI and MACD for signs of trend shifts, but the real indicator will be watching the 2.46 and 2.00 level.

Virtuals On Base $virtualThe chart is clear, Max target doesnt mean it has to hit. Doenst even mean I am right, but if we drop for now the first support/liquidity area is at 1.70.
Can we go lower? Yes
Moving averages support at .82 and .40, , not in the chart.
I like Base and I think Virtuals is interesting.
I don't do leverage trading, only Spot trading.
I wanna sleep at night.
