$VRA | VERASITYNASDAQ:VRA has clearly bottomed.
VRA Spot Buy
- The latest burn of POV will further reduce supply
- Migration to #TRON soon
Safe LONG Term HOLD
Targeting 10x+
VRAUSDT.P trade ideas

VRAUSDI am sorry to say that even I bought at like 5-6c on this coin and I do not see this coin going back to that level again.
We are lucky to even get 2c on this run if that does happen.
They need to burn 1bil coins for this to make a move up

VRA Move Ready...Buying Opportunity:
The price is currently near the right shoulder, slightly above the 0.002699 USDT support line. This suggests a low-risk entry point .
If the price moves upward and breaks the neckline at around 0.003013 USDT , this could confirm the bullish pattern, making it an ideal buying zone .
Target:
The green zone between 0.002699 USDT and 0.003013 USDT provides the target area for price movement, with the breakout potentially leading to a test of the resistance at 0.004064 USDT.
After the breakout above the neckline, a conservative price target could be the distance between the bottom of the head and the neckline added to the breakout level. This could project a target near the 0.004064 USDT resistance.
Conclusion:
A confirmed breakout from the neckline (green line) would trigger a bullish momentum, providing a solid buying opportunity with a potential target around 0.004064 USDT.


VRA Cleaned up short-term predictionKUCOIN:VRAUSDT Cleaned up version of my previous post prediction. Go back and look at Q4 Verasity 2023 and come back at look it this setup.

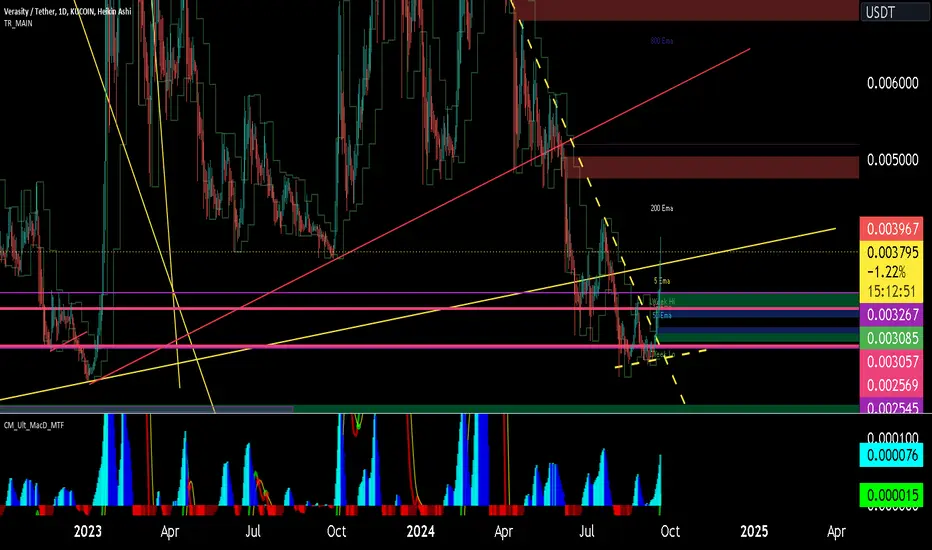
VRA 4H possible SHORT setup - Oct 07 2024If VRA makes a 4H close below the blue trendline, it will probably drop to lower levels.
Targets would be: 0.002780 - 0.002640 - 0.002480 - 0.002335 and SL would be just above the blue trendline.
One should keep in mind that the trigger is a strong 4H close below the blue trendline

VRAUSDTwho is ready to bull run with VERASITY
we are in very bullish area from the current moment and current price

Verasity is a must buy right nowKUCOIN:VRAUSDT Verasity is currently in a big Curve pattern last seen in the previous alt-coin bull market. May go side-ways for most of October but then will get pushed up as seen in the photo.
The other photo is from Verasity’s last huge run in 2021.

Inverse Chart of VRA | Huge "Dump Inbound" | Mid Term (1D)Inverse Chart of VRA | Huge "Dump Inbound" | Mid Term (1D)
We've finally gotten to the interesting part of the crypto cycle. So many altcoin charts are looking ripe for the picking.
I personally plan for all outcomes and have plans and contingencies for best, worst, and middle of the road scenarios.
If BTC corrects, it will be very aggressive and quick deep wick down harsh. Which means, plan for altcoin picks on average to correct in panic with it 20% to 60% down.
My portfolio is heavily skewed towards BYBIT:CSPRUSDT and I have staggered limit buy orders in and waiting for most coins, but CSPR most of all.
Just for a little perspective, I like to do the inverse of a chart I'm looking at (Keyboard Shortcut ALT + I in tradingview). Then I ask myself the question, if I were to glance at this chart not knowing, just at face value, would I long this coin that looks like this? For me, the answer is heck no.
REFERENCE:

Mock Up Price Action for VRA w/ Timeline | Mid Term (3D)Mock Up Price Action for VRA w/ Timeline | Mid Term (3D)
We've finally gotten to the interesting part of the crypto cycle. So many altcoin charts are looking ripe for the picking.
I personally plan for all outcomes and have plans and contingencies for best, worst, and middle of the road scenarios.
If BTC corrects, it will be very aggressive and quick deep wick down harsh. Which means, plan for altcoin picks on average to correct in panic with it 20% to 60% down.
My portfolio is heavily skewed towards BYBIT:CSPRUSDT and I have staggered limit buy orders in and waiting for most coins, but CSPR most of all.
REFERENCE:

$VRA #100x from hereVRA Chart update
Wave 2 completed with irregular flat correction
invalid below yellow line
resistances
1= 0.029$
2= 0.087$
Wave 3 completes around 0.087$
40-50% correction for wave 4
& then move towards final wave 5 target
around 0.8-1.4$
#NFA
#DYOR
press like and follow

Buy Trade Idea for Verasity (VRA)Description
Verasity (VRA) is a promising cryptocurrency in the digital entertainment space, offering innovative solutions to challenges in the online video, esports, and ad-tech sectors. Key fundamentals that make Verasity a strong contender for a buy trade include:
- **Revolutionizing Online Content:** Verasity provides blockchain-based technology designed to enhance video monetization and viewer engagement through its proprietary Proof-of-View (PoV) system. This unique system combats ad fraud and ensures that views are legitimate, increasing the trustworthiness of content and advertising.
- **Esports and Gaming Focus:** Verasity has a significant presence in the fast-growing esports and gaming industries, leveraging its technology to enable transparent rewards for players and viewers, as well as efficient tournament hosting.
- **Growing Adoption and Ecosystem:** Verasity is forging partnerships with major platforms and advertisers, positioning itself as a leader in blockchain-based ad-tech solutions. The increasing adoption of VRA tokens in these industries signals strong long-term potential.
- **Token Utility:** The VRA token is integral to the ecosystem, used for staking, rewards, and transaction settlements, which drives its demand as the platform grows.
Given these innovative applications and growing use cases, Verasity presents a compelling buy opportunity for investors looking to tap into blockchain's integration with digital entertainment and ad-tech.
Disclaimer
Cryptocurrency trading involves significant risks, including the potential for loss of capital. This information is provided for educational purposes only and should not be considered as financial advice. Verasity and its ecosystem are subject to market volatility, regulatory changes, and technological developments that can affect the value of the VRA token. Always perform your own research, assess your risk tolerance, and consult with a financial advisor before making any investment decisions. Past performance is not indicative of future results.

Verasity $VRA #VRA ! zoom out Vra needs to hold 0.00366 if it does for next few days we might see reaching for the red zone where we can grab liquidity
Is #VRAUSDT About to Explode? Critical Levels You Should WatchYello, Paradisers! Could this be the moment we’ve all been waiting for #VRAUSDT? Let's look at the latest analysis of the #Verasity and see what's happening:
💎We're seeing the strong potential of #VRA for a bullish continuation from a key bullish order block at $0.0024. For those of you tracking NASDAQ:VRA , this one is showing signs of gearing up for a bullish breakout.
💎 NASDAQ:VRA is currently following a descending channel pattern, and a breakout from this channel could send prices soaring. The first key target after a breakout is the internal minor resistance at $0.0034.
💎If #Verasity holds steady above $0.0024, we could be on the brink of a significant rally. We've seen explosive moves like this before, and a breakout above the critical resistance at $0.0034 could pave the way for a run toward even higher resistance zones.
💎But, caution is key, Paradisers! If momentum weakens around this critical demand zone, we might witness a pullback to the lower demand area in the $0.0021-$0.0022 range. A daily close below $0.0024 could invalidate this bullish setup and open the door to further declines.
Stay focused, patient, and disciplined Paradisers.
MyCryptoParadise
iFeel the success🌴

#VRA/USDT#VRA
The price is moving in a descending channel on the 1-day frame and is sticking to it very well and is expected to break it upwards
We have a bounce from a major support area at the lower line of the channel at 0.002280
We have a downtrend on the RSI indicator which supports the rise
We have a trend to stabilize above the 100 moving average
Entry price 0.002690
First target 0.003437
Second target 0.003936
Third target 0.004650

VRAUSDTVRA ~ 1W ✅
#VRA Make purchases gradually on this support block. Make purchases twice for the worst case scenario.
Target at least 20%++

VRAUSDT bullish trendIt is gathering strength in the support area for a short throw towards the resistance

Verasity (VRA): 2 Ways 2 GoThe Verasity coin is at a very interesting spot where, after a breakdown from our upper target zone and a successful re-test that happened on July 18, we are now facing new all-time lows on the coin.
Price seems to have been forming a nice support zone, which might go 2 ways from here.
No matter where, if we see a breakdown, a good short should follow and if we see a bounce from here, a good upward movement will be there!
Swallow Team

Another Gem Not Getting the Attention it DeservesIf BTC tanks to 38-42k and drags the rest of the market with it, I'll be DCA buying in further on KUCOIN:VRAUSDT , otherwise if BTC turns Reverse Cramer rules bullish, I'll sit and wait and hold my speculative altcoin bag of VRA and wait to confirm bottom structure and reversal.

VRA USDTVRAUSDT
i predict third wave on next couple weeks
this trade will be invalid only if price break 0.00211
market cap is 25 million only

VRA may be painting strong double bottomIf you recall, VRA recently broke out from a falling wedge formation but was subsequently rejected after reaching the immediate supply area. As a result, its price has been dropping. However, it has now reached a significant support/demand zone, which has become an important point of interest. We've observed the price bouncing from this zone.
If this upward movement continues, we could potentially see the formation of a strong double bottom pattern. Our plan would be to ride the coin's momentum and closely monitor how the price reacts at the supply area. The chart provides a target for your trading decision.
We would love to hear your thoughts on VRA in the comments section.

VRA Idea of the All Time Chart.Verasity's all time chart look very optimistic for the long term once a spring happens from below the $0.0021 level.
The cancelation (if the spring doesn't occur)/ confirmation (if the spring occurs) is above $0.0152.

Potential Big Move for Verasity (VRA)? History May Rhyme...Hello there, fellow traders!
I’ve been taking a close look at Verasity (VRA) and wanted to share an interesting pattern I’ve noticed on the VRA/USDT chart from KUCOIN.
This is my first time publishing an idea, so feel free to counter my idea as I am eager to improve. Before diving in, remember, this is not financial advice (NFA) – always do your own research and invest wisely!
Historical Patterns:
Looking at the daily chart, Verasity has shown some impressive movements in the past. Check out these key points:
Previous Cycle (A to F):
Starting Point (A): After a period of consolidation, VRA took off.
Peak (F): The price surged by an incredible 36,859.39%!
Current Analysis:
Potential Bottom (D?): We seem to be at a similar point to previous lows, suggesting a potential new cycle could be beginning.
Future Projection (F?): If history repeats, we could see a rise of around 21,059.58% from current levels.
Why This Matters:
Patterns like these can offer valuable insights, especially for those looking to time their investments. If VRA follows its historical trends, we might be in for a substantial upward movement.
Key Levels to Watch:
Support Levels: Around the “A” and “D” points, where prices have historically bottomed out.
Resistance Levels: The “B” and “F” points, marking significant peaks.
Final Thoughts
While these patterns are promising, remember that cryptocurrency markets are highly volatile and unpredictable. This analysis is based on historical data and past performance does not guarantee future results.
As always, this is not financial advice (NFA). Be sure to conduct your own research and consider your risk tolerance before making any investment decisions.
Happy trading and let’s see where VRA takes us next!
