Vertcoin Setting Up Massive PLAY!!! (VTC)Symbol: VTCUSD / VTCBTC
Let's compare VTCBTC bottom chart and VTCUSD top chart. The bottom is a monthly performance and you can see we are getting some whipsaw action to curve up after hitting lows around all previous runs. Now up top is the weekly vtcusd wedge. Is it ironic that the wedge is breaking when the monthly below is curving up? If you zoom out on chart look how VTCUSD top chart is a massive potential cup and handle with a wedge squeeze. I'm bullish!
Long term hold.
Follow Major League Trader for daily analysis.
----------------------------------------------------
Want to level up your trading skills?
We just realesed our new course! Follow our tradingview page and visit the link in our bio if you are looking for new strategy to add to your arsenal.
Also checkout our trading indicator available in the link on our page.
---------------------------------------------------
Thank you for your continued support, God bless.
- Major League Trader
VTCBTC trade ideas

VertcoinStock Symbol: VTCBTC
I've been watching this one since towards end of last year at these levels. The monthly looks like it's getting ready to flip as my candles are compressing and firing long. I think this is a steal of a deal. Compare to the last rally. Weekly also looks strong.
Diversify and use 5% stoploss
----------------------------------------------------
We just realesed our new course! Follow our tradingview page and visit the link in our bio if you are looking for new strategy to add to your arsenal.
Use Promo Code: FIRST100 to receive $50 off of your course!
First come, first serve / Code valid for first 100 buyers. Normal price $99
---------------------------------------------------
Thank you for your continued support, God bless you though these times.
- Major League Trader

Long term BULLISH VertcoinHistory is repeated.
Vertcoin has been depressed for long time, but now it's started to move up and we can see the same pattern in the past.
We are entering into the BULL MARKET.
Take a look at it.


VertcoinGreen monthly at all time low in sats. If you ain't hodling sheeeetcoins right now for the long ride....
You are blind.
Diversify and fill up your bags

VTC bullflag or scallop?Bullflag or scallop? An inverted scallop has a backwards and inverted J shape, and leads to bullish continuation after a small pullback, while bullflags send the price rocketing. Either way Vertcoin looks in good shape for upward movement. Daily chart. Ill link my vertcoin 'pipe tops' if you would like to know about pipe tops.


VTCBTC Accumulate!The overall area of current purchase is an awesome price to buy and hold.
Come on... It's damn near bottom.
Good luck!

VERTCOIN MACD CROSS AND BULLISH MOMENTUMVertcoin is looking to make some moves up. A nice lil' 40% trade.
Who knows?
Good luck.

VTCBTC PipesPipe bottoms lead to a short term bullish reversal and vice versa, these are identified best on the weekly chart. 'Pipes commonly form after in a retrace in an uptrend or at the bottom of a prolonged downtrend' These formations are more common in bull markets.


Vertcoin symmetrical triangle about to bust... BITTREX:VTCBTC
I don't think this gap can get any tighter...


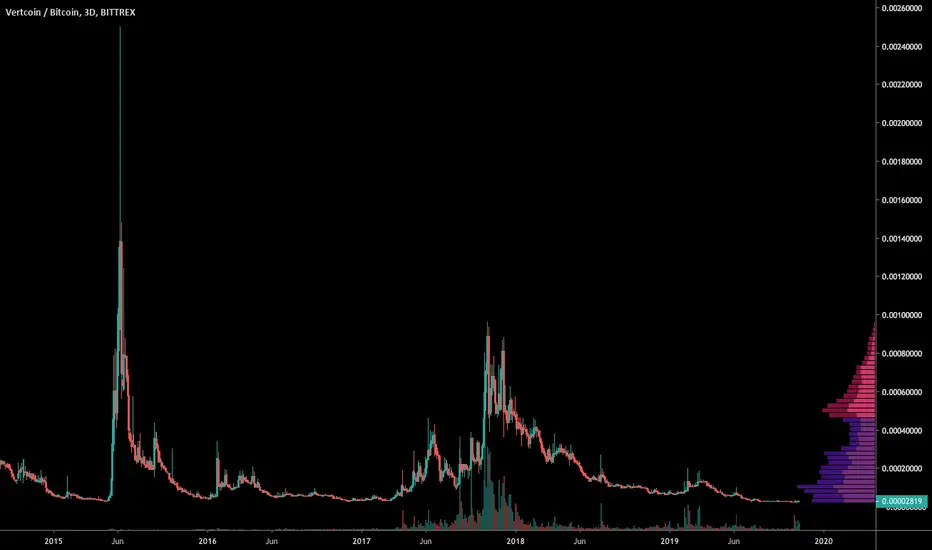
Vertcoin (VTC) Short & Long Term | 8240%+ To ATHVertcoin (VTCBTC) hit a new ATL (All-Time Low) back in mid-July 2019... No big deal, many altcoins hit new ATLs but... This one might be a bit different...
Let's get started!
Vertcoin (VTCBTC) has been available on Bittrex for trading since February 2014.
The new ATL was hit at 0.00001877 on the 15th of July 2019. A classic bounce followed by additional bleeding and VTCBTC hit another low at 0.00002154. This time a higher low compared to the ATL. Now we see VTCBTC moving above EMA10 (0.00002857) on the weekly time, activating its bullish potential.
If you are not following or just a bit lost... What I am getting to is the fact that Vertcoin is about to grow and most likely BIG.
8,200%+ Of Profits Potential | VTCBTC Weekly Chart
A closer look at the weekly chart
Here we can easily notice the move above EMA10 (green line) by the last candle.
The MACD is trending up and the histogram is now green.
The RSI is trending up and printing bullish divergence. The divergence is also there with the MACD.
We have above-average volume this week, the highest since June 2019.
So we have multiple signals that are pointing towards growth for this altcoin project/trading pair.
Now let's take a closer look...
On the chart above, the main chart, we have the daily timeframe, here it is easy to see the bullish action that is just starting to develop... We have:
Increasing volume.
Break above EMA50.
Bullish RSI.
MACD above 0.
Altcoins market in general growing.
Many, many of the Bittrex altcoins, and there are hundreds, are moving up above resistance and printing bullish charts.
The altcoins market is heating up and preparing for massive growth... MASSIVE.
In a few weeks, you will see people wondering and thinking... "Oh my god, it was at "x-x-x" price for so long... I did not buy and now it is going up and up and up... Can I buy now? Will it start to drop? When to buy, when to sell...?? Ahhhh"
When that time comes... Do not worry... Even more opportunities will show up.
Namaste.


#VTC $VTC #VERTCOIN Approaching all time low supportTime to see if this project is going to last or not.
Binance bans U.S. citizens from trading on September 12th. This project is not on Binance, but the ban should bring some more volume into U.S. based exchanges like Bittrex.
It may just be perfect timing for Vertcoin to see some action....... or slowly disappear.
I really like this project, and hope it succeeds. It's worth entering at support w/ a stop loss. This is my opinion not financial advice.

VERTCOIN / BTC - VTCBTCHi traders
before the analysis one comment from my side:
my personal opinion is that most of the altcoins will disappear (possibly within one year, max two, based on my estimation)
Based on that I would not personally trade coins with low liquidity, as you can see in the chart, there is at least an example of one candle that fluctuate the price up and down moving it almost 35% in few minutes
I don't find major algorithm target in the chart and the wave count is very difficult and I think would just confuse me more..
what I can see is that the latest part of the chart, might looks like an accumulation zone... but again... difficult to say it in a chart that, beside the first spike up, is only a downtrend!
If i would risk a small amount and possibly consider it lost forever, I would consider the last wave up as a first wave and buy in the yellow zone with stop loss at the dashed red line
Overall, I will not touch this cone
These are only my personal opinion , this is no financial or investment advise.. I am not a professional, and what I do is just for fun :)


VTCBTC formed bullish Butterfly | Upto 464% expected from herePriceline of Vertcoin / Bitcoin cryptocurrency has formed a bullish butterfly and entered in potential reversal zone.
RSI is oversold.
MACD is turning bullish.
From here the price action will take bullish divergence soon insha Allah.
I have used Fibonacci sequence to set the targets:
Buy between: 0.00002087 to 0.00000001 (But the price action cannot go more down coz are indicators are turning bullish and RSI is oversold)
Sell between: 0.00007632 to 0.00015702
Regards,
Atif Akbar (moon333)

Vertcorn Can buy at lower range of wedge or the breakout. 4h close is the key for breakout. stop if wedge breakdowns

