VTC/BTC 106% Potential gains Vtc showing some profitable future movements
Trading Indicators
macd shows positive growth after such a downfall, ready to attempt to retest previously failed highs
rsi shows momentum gaining
price is still under ichimoku cloud, but growing towards it ready to test resistance
we can see the price doesn't stray far from its support line, with that said stop loss can be set tight for the least loss
Trading Plan
Buy in: .00039-.000044
Stop loss: .00035 10-20% depending on when you bought in
Targets
.0000557 26.59%
.000059 34%
.000062 40%
.0000673 52.9%
.000077 75%
.000091 106%
VTCBTC trade ideas

VTCBTC bittrexhad holdings 0.012 @ 842 ,
S. 0.014@95.
Support is now resistence.
Support analysis
alt coin wake up analysis


$VTC - VertCoin ~ Ready to leg up. Fundamentals coming.$VTC - VertCoin HIGH RISK, GREAT RISK TO REWARD THOUGH
CMC: coinmarketcap.com
CMCAL: coinmarketcal.com
Acquire: 9588 to 9788
STOP LOSS IMMEDIATELY AROUND 9300
Short Term Targets:
First: 9941
Second: 10334
Third: 10652
Fourth: 10969
Mid Term:
First: 11423
Second: 11999
Third: 12731
Fourth: 13114
This coin has been forgotten about, It was right up there with $LTC last year due to segwit. seems to be finding support again. higher low by the looks!
The R/R is awesome. Let's see how she goes!

VTC consolidating on Perfected Monthly 9 BITTREX:VTCBTC flashing perfected 9 Buy on Monthly timeframe per TD....also just happens to be consolidating very nicely near bottom range of a nice channel for 60+ days.
Check mark on chart was when it went 110%ish in <6 hours thanks to a small pump-group (this thing moves very fast both directions due to lower liquidity AND IS why it's been the target for pump groups and whales in the past).
Get in while the gettin is good lads.


Good entry , The profits will reach 880%hello every body
# Buying and selling is written on the chart .
# The Bollinger Bands on the daily chart have become very tight and we wait strong liquidity to start .
# We have a resistance in the way in 12000 is moving average (100) , 17000 moving average (200) .
Good luck for us

VTC falling WedgeVey nice fib cycles of 618 - 0.886, expect test support 2250/80 sats if no bounces from 0.886

Keeping an eye on #Vertcoin / #VTC for the following weeksDaily prediction for the following days / months - Personally I think VTC has reached the apex point and it's very near to trend reversal that may come in early November

Vertcoin bottom?Vertcoin looks to be basing out here, 10k sats strong support & definitely a good area to start those buys ready for the next cycle, I will be targetting the 1.618 in next cycle. Roughly 150k sats

VTC oversold and gaining momentum. Possible 9% profitMACD gaining momentum, %R showing oversold, wait for -80 breakout just to make sure. Sell at overbought around 0.000108/9


VTC long term buy areaSuitable for a bounce area.
Great area to buy for long term hold.
Could also go to the previous lowest lows ntzntzntz

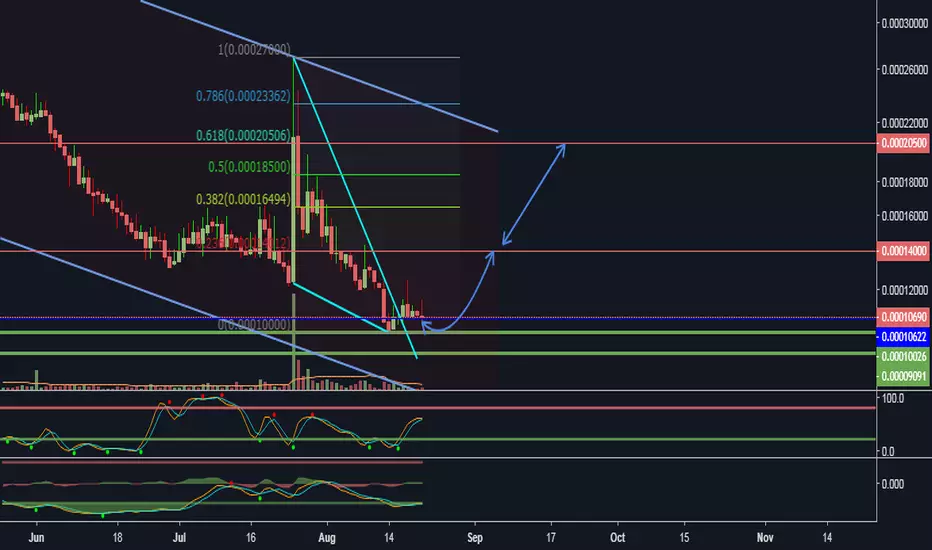
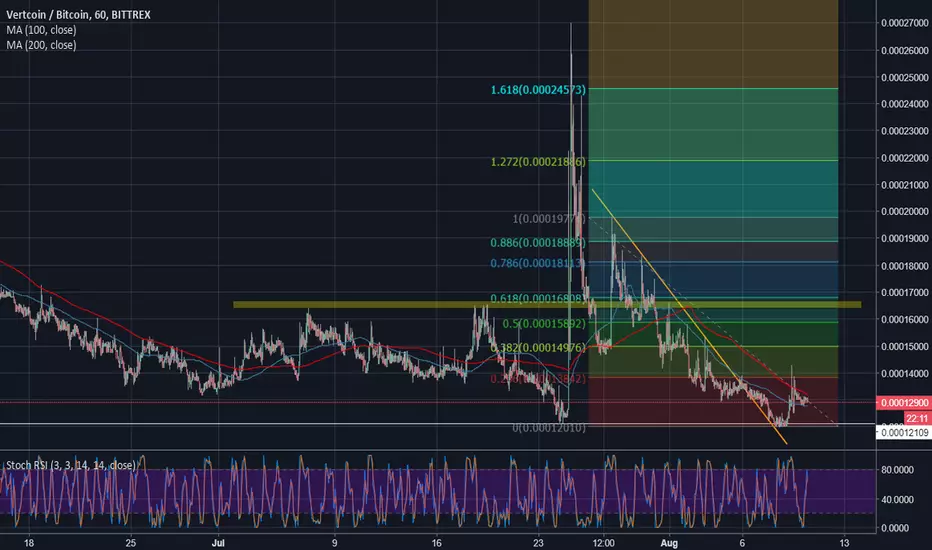
Vertcoin is bouncing Vertcoin has pushed above the minor trend line that has kept the coin under for around 10 days. The move facilitated the collection of stops which pushed the price higher to the first Fibonacci retracement of 23.6%. If the retracement is really serious, then a bigger move to the upside should follow, to at least 38.2% retracement or higher. The bulls will get more support as the price could not break the horizontal support around 0.0001200. On an hourly chart, the price is stuck in between the 100 and 200 MA. If the price moves above the 200 MA as well, then a move to 38.2% retracement is on the cards. If you are looking to buy, put yours stops below the 100 MA as that is the nearest risk for the bulls. Any move and close below that indicator will put more pressure on the bulls.

VTC on 2 day timeframe - 2 scenarios! Pick yours ;-)First and foremost: I am biased with VTC as I like the project alot. Nevertheless my as objective take on TA on it:
There are 2 possibilities here by simply looking at s/r + historical patterns on the 2 D chart:
A)
There is a possibility that we are leaning towards gaining momentum with VTC as we do have a falling Wedge pattern with a breakout and retest as of right now.
This is supported by the forming of bullish divergencies on the MACD (both histogram as well as momentum of the EMAs / MACD line). Be aware that these divergencies are there but they could continue to form in another "downswing" move for a bigger timespan, before it actually starts to show in price action. MACD line itself is still below 0 and since we already had our crossover it remains to be seen if VTC can carry the momentum over the magical 0 line.
RSI does not show any divergencies on higher Timeframes as of now. Volume did show some form of life - however I do not take volume as the most important indicator.
Bonus: Looking at the green rectangles it allows interpretation of potentially having a similar scenario to last falls run. A long term support line that turns into resistance and then gets tested and taken out 1-2 weeks later (wen moon? 2 weeks!)
B)
Since the potential fractal is subjective for sure - this can actually also be a legit retest of former support line that now has turned out to be a monster of a resistance line. We got shotdown hard by it and the Itchimoku cloud on the daily timeframe - further making a case for a smackdown and a prolonged bear scenario.
It should be noted that that resistance line does have historic value as its a horizontal support line that has been tested in the last 12 months multiple times!!
MACD still is below 0 and it is possible that we will see a negative crossover soon, since the histogram is ticking downwards indicating that sell pressure is kicking in like Beckham used to do with those 21 meter free kicks.
As of now: 12 k will have to hold and eventually we have to bounce from the falling wedge in order to confirm bullish momentum.
If we fall through next support levels to look at are 9k, as welll as 7,5k and 5,5k. Either way, longterm this is a buy. Depends on the type of trader you are - if you wanna get in when bullish momentum is confirmed or if you wanna play s/r lines with close knit stops!
Cheers!
