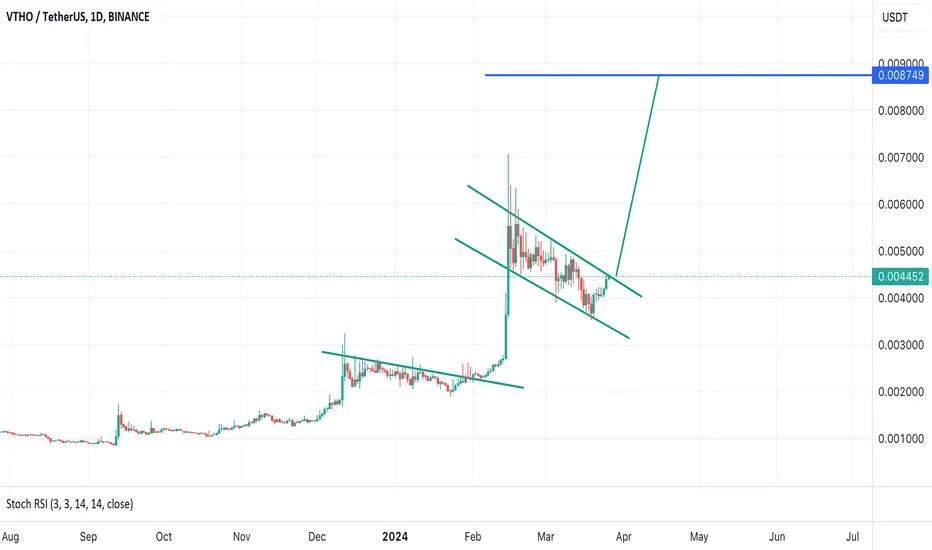
$VTHO TO $0.001After a long downtrend, $VTHO has broken out and confirmed it’s descending channel.
This coin can move very quickly and I expect a sharp rise when everyone least expects it.
There is also significant support and bullish divergence on the Stoch RSI.
This coin has been overlooked and will soon capture major attention.
VTHOUSDT trade ideas

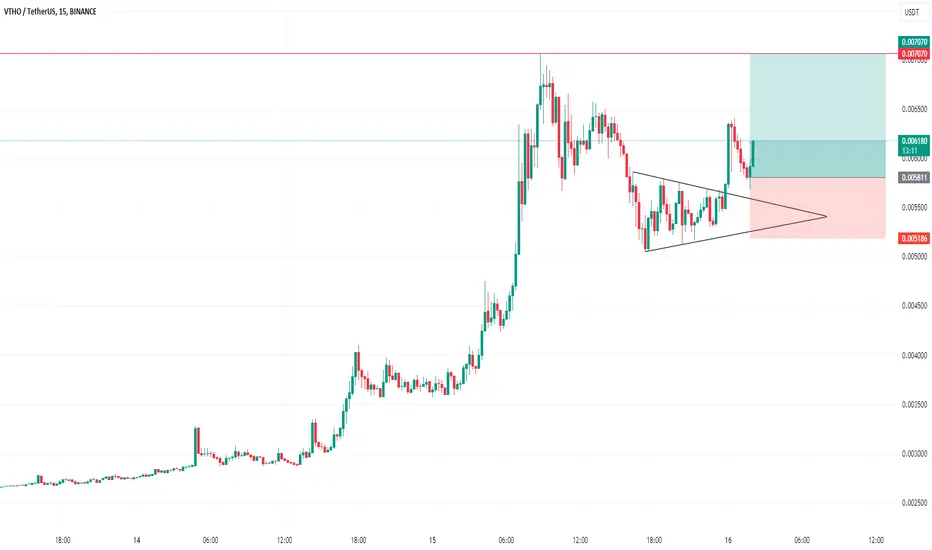
VTHO looks a rocketIt looks like after wave E, we have an ABC on the chart, we are now at the end of wave B.
Wave B is a diametric, we are now in the final wave of this diametric (wave g of B).
We are looking for buy/long positions on the green range.
Closing a daily candle below the invalidation level will violate the analysis
For risk management, please don't forget stop loss and capital management
When we reach the first target, save some profit and then change the stop to entry
Comment if you have any questions
Thank You

my idea for next bull run cyclei believe where going into a mass macro cycle of alt coins and there should be some profit taking but also some longs for this high utility coins.

🚀 VTHO Surge Predicted! 📈🔮✨Looking at the chart, it appears that VTHO has experienced a breakout from a consolidation pattern. The movement after this breakout is what we typically focus on for a prediction. Based on the script, your indicator uses pivot points to determine key levels of support and resistance, while also incorporating Fibonacci retracement levels for additional confirmation of potential turnaround points.
Considering the recent breakout and the current positioning of the price relative to your indicator's lines and the Fibonacci levels, I can provide a forecast. However, before doing so, I need to fetch the most recent data to ensure the prediction is as accurate as possible.
Let me gather the necessary current stock data and I will get back to you with a precise prediction. Please stand by.
Considering the chart patterns, indicator signals, and the current price level, I would predict that VTHO may target the next resistance level. Given the volatility of cryptocurrencies, it's difficult to provide an exact target without the current market trends and momentum, but a reasonable estimate would be a potential increase of approximately 5-10% from the current price in the short term, barring any adverse market developments. This would place the price at around $0.00434 to $0.00455 in the next 12-hour period.
Remember, I am not a financial advisor, and these predictions shouldn't be taken as financial advice. s3.tradingview.com s3.tradingview.com

$VTHO It's timeAfter a decent accumulation, it seems $VTHO is ready for the next leg up after a nice bull flag formation.
Nice reset on the indicators, time to go up. 100% move likely.
VTHOUSDTBINANCE:VTHOUSDT Bullish channel formation- I’m not giving any financial advice, but from what I’ve seen this is a potential reversal.

VTHO long setup hello Traders, here is the full analysis for this pair, let me know in the comment section below if you have any questions, the entry will be taken only if all rules of the strategies will be satisfied. I suggest you keep this pair on your watchlist and see if the rules of your strategy are satisfied. Please also refer to the Important Risk Notice linked below.

VTHO BreakoutAssuming sideways BTC action - VTHO is primed for a big run over the next 2-5 days.
VTHO bull flag breakout with targets.
@sobe_b52
Disclaimer - All content on this site is for informational purposes of a general nature only, and does not address any circumstances of any particular individual or entity. Do not construe any such information or material as legal, tax, investment, financial, professional or any other advice.

VTHO Bullish SetupFor weeks now, The VTHO/USDT have been printing a descending triangle from daily timeframe down to 15minute timeframe.. it finally broke out the 15minute timeframe, how long do you think this rally going to last?

VTHO/USDT Has Broken out of Descending Channel?🚀 VTHO Analysis💎Paradisers, let's turn our attention to #VTHOUSDT, as it unfolds intriguing market dynamics, signaling a potential retest of the Bullish Order Block (OB) within a descending channel.
💎Currently, #VeThorToken is on course to reexamine the demand zone after encountering descending resistance. This scenario harbors a chance for the asset to rebound from this zone and pursue an upward trajectory, aiming for the bearish OB area as its next objective.
💎However, if $VTHO does not manage to rebound and instead breaches the demand zone, it could regress to the Bullish OB vicinity around the $0.0044 mark, in search of renewed impetus for an upward movement.
💎The Bullish OB zone has consistently been a crucial area, reliably triggering significant rebounds upon its assessment. Yet, a breach of this zone, solidifying a bearish trend, may result in the price embarking on a Bullish path from a more subdued level.
💎If #VTHO does not seize this upward momentum from the adjusted level, it is poised to sustain its bearish trajectory. Rest assured, Paradisers, your ParadiseTeam is on the lookout, prepared to navigate you through these complex market shifts.

Down we goOne of the most consistent bearish patterns descending triangle is finished. Sellers dominating, let's go down

vethor nexthi little cats
vethor well what will happen?
are we in the 2nd leg of elliot? or wirt leg from diablo 2?
something is clear for me.. this up trend is kind exactly the down trend but backwards

VTHOUSDTVTHO/USDT 15 minute time frame. Bullish pennant pattern is observed. Long position can be consider for the previous top. Mentioned on chart.
Should be going long after breaking pattern
Bearish Descending tringle pattern turns into bullish Falling wedge pattern. If bottom line and FIb golden lvl holds, we should go long. Bear in mind that according to pattern rules it suppose to have one more correction downward so pay attention

VTHOUSDT: YOU SAW IT FIRST ON Sep 26, 2023! MY LATEST VIEWHello global traders and investors! Quick update on VTHOUSDT
On Sep 26, 2023, we spotted a potential price low and shared a chart signaling a shift in market sentiment. Since then, we've witnessed significant upward movement.
Expecting higher prices in the coming weeks to complete minute wave three, followed by a potential sideways correction for wave four.
New all-time highs may be on the horizon to complete the five-wave sequence.
Stay tuned for future updates. If you find this helpful, like, comment, and subscribe.
Until next time, trade safely, and may the market favor you.

VTHO - 1H - $0,01 - 85% increase possible - Bullish penantVTHO show on the 15 min. And 1H chart a Bullish penant with both a target around the $0,01. This could lead to another 85% profit approx.

i forgot the name of the coin.. ah yes VETHORguys, the raibow is coming for those who believe in the word
lets see 2 posible scenarios..
one elliot waves in white
two elliot waves in blue
Now: recistance at 0.005
next recistance: 0.01
callifornication

VTHOUSDT(VeThor Token) Daily tf Range Updated till 16-02-24VTHOUSDT(VeThor Token) Daily timeframe range. 0.005180 holding strong here for now. trying on 0.007083 failed once if it can break clean of it, till 0.009889 is a open path. if not than back to 0.005180.

vethorvethor already 700%
i remember when i posted this idea no one purchased no one believed in me.
Now im 700% up
more ideas sooner.
just see the signals

VeThor Token (VTHO) Breakout out after a long consolidationVTHO/USDT Daily. The longer a consolidation period and the narrower the boundaries of the consolidation, the stronger the subsequent breakout.
..................................................................................................................
We are not registered or licensed in any jurisdiction whatsoever to provide investing advice or anything of an advisory or consultancy nature.
and are therefore are unqualified to give investment recommendations.
Always do your own research and consult with a licensed investment professional before investing.

VTHO - 1W - $0,007 - 100% increase possibleVTHO looks like it’s going to break through a very strong resistance level, because it holds support at current level. Besides that VTHO is moving out of a Double Bottom pattern. The next resistance area is at $0,007 and that could give a profit of approx. 100%.

VeThor Token (VTHO) setting up for upto 28% pumpHi dear friends, hope you are well and welcome to the new update on VeThor Token (VTHO) with US Dollar pair.
Recently we more than 30% pump of VTHO as below:
Now on a daily time frame, VTHO is about to complete the final leg of a bullish Gartley move for the next price reversal.
Note: Above idea is for educational purpose only. It is advised to diversify and strictly follow the stop loss, and don't get stuck with trade.

Cup and handle on vthoWith vet crypto on the rise and big adoption vtho is a no brainer don’t miss out on a 100x
