WANBTC trade ideas


WAN BullishWAN
Volume increasing here, looking good on the CCI, nice bullish divs. Personally I think we're going to run to R1, maybe R2.

Wanchain Chart Analysis (Weekly & Daily Time Frames) + TargetsWanchain (WANBTC) Chart Analysis
Let’s start with the long term chart, simple and straight forward:
Last weekly candle closed in a Doji, reversal signal.
New all-time low for the Doji candlestick.
Above average volume.
Market sentiment changing from bearish to bullish.
When we look at it shorter term we have all the same classic signals… They are the same because these are the only signals that we need in order to find a potential bottom and come up with a low risk and potentially highly rewarding trade, this is all incredibly easy for us, it is even fun and entertaining most of the time:
Here we can see the bullish divergence again.
Volume slowly increasing.
Trading above EMA10.
The RSI hit oversold and is now poised to move up:
And that's it, that's the analysis... Make sure to hit like if you enjoyed or would like to show some support... It only takes a few seconds and we really appreciated.
Namaste.


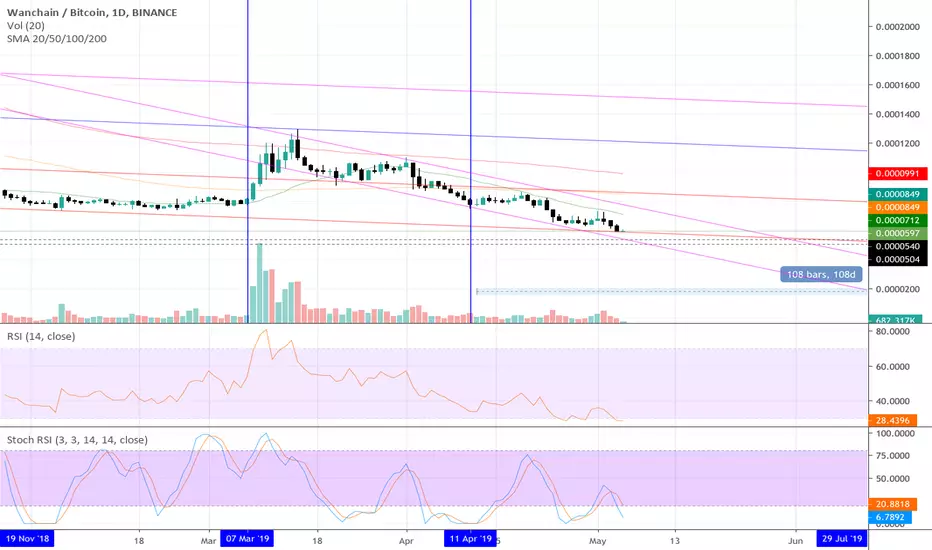
$WAN Another Alt trapped in a descending channel...$WAN Another Alt trapped in a descending channel...
For now I dont see volume/ signals of bouncing...
For now place alerts for when this channel is break to the upside (look for volume...)
45% down since the UCTS sell signal on the daily...
#WAN


SoT 2.0 Chartoff May, Week 3Analyse of WANBTC:
- Broke an hourly downtrend (pink).
- Is attacking the daily resistance at 574 (yellow).
- Is currently laddering along his hourly uptrend (pink).
Setup Proposal:
- Entry: 497
- Target: 574 ( ~ 15.0 %)
- Loss: 485 (~ 2.4%)
Good luck !

$WAN Can Possibly be Your Best BetThis one used to be my favorite back then.
Fundamental side, WAN Chain is pretty much a bunch of good people made a pretty good team at the moment, if you look at their twitter account they are sometimes reveal they activity in the process of developing WAN. I love this part, it makes me closer and can see clearly what people's do, how they do, where they do and pretty much they gaining my trust, and others.
Only 100+ mil on the circulating and 210 mil on total supply... $38 mill market cap.
Cheap!
**************************************************************************************************************************************************
If all of these ideas I posted helps you, give them thumbs up, shares, comments and follow me. If you have a suggestion, just fill in the comment sections or message me. Looking forward to hear from you all. Thanks a lot!
TIPS: PATIENCE & PERSISTENCE ARE KEY TO SUCCESS
RISK WARNING: Cryptocurrency investment is subject to high market risk. Please make your investments cautiously. I will make best efforts to bring profitable signals, but will not be responsible for your investment losses or profit.
--------------------------------------------------------------------------------------------------------------------------------------------------
www.tradingview.com Rules:
#1 Always obey tradingview.com house rules
#2 Always read the description
#3 Don't spam on the comment section
#4 If you wanted to request my opinions about a coin/token just give 10 likes on my published charts and I will do it the day or two after
#5 My opinions are not financial advice, follow it at your own will and your own risk
#6 Together, let's build a better community on this platform


WAN Capitulation/Game planWAN Capitulation
Retest of the range low, turned into resistance (R1), from there we saw a sell-off.
For those thinking of knife-catching, I would advise much caution. We don't know exactly where the bottom is, better let others catch the knife, and buy the retest.

WANchain - bad timing for bull run. we will see new ATLRSI, STOCH RSI, MACD, Volume decreasing and not in good harmony.
Something should happen soon, i guess we will see new ATL before direction will be changed.


BINANCE:WANBTC - ALT SEASSON -Buy on :
Breakout 613,
Correction 560-577,
Demand: 514-535,
.
SELL:
Target 1: 635-654
Target 2: 672-697
Bull: 771-793

$WAN On price discovery for a new support ...$WAN On price discovery for a new support after breaking down ATL BTC Support
Currently over 34% down since the UCTS Sell signal on the daily chart
Potential support (with help of Fib Retracement levels) can be expected at around 6k sats..
I will update as I see changes
#wan

(WAN-BTC) last chance 60% move upsitting on the bottom of our channel fighting between two 618 one has light one has a deep valley who will win...
this is not finical advice I'm a usd bag holder only trade alts at you're own risk


WANCHAIN BOTTOM?I think we have seen the bottom of Wanchain now. Onward and upwards. Keep a tight stoploss as if a break of this low its completely unkown territory!

WANBTC - next buy opportunityWanchain looks weak for now. I think we are a few weeks away from the next buy opportunity. It doesn't mean that WAN won't dump even deeper, just that we have to be focused once WAN reaches the mentioned target.
Updates to be followed.
Have a nice one!

WANBTC, nice 30% swing potentialHello fellow traders! Welcome to Spacepeso's third chart! Lets dive right into it.
WAN made a nice 70% run in this small alt cycle. It retraced hard back to 650 area and that is where I will enter my trade. All depends on btc , a big btc move could drop WAN hard so its always risky in the crypto space.WANBTC made a new low and seems to have found bottom after a 50% drop.
Measured move indicates to me that we might have a nice 20-30% upward move.
Stoploss i set just below that red line.
My target is just below that area where we see a lot of locked up capital. Which often acts as resistance. Bullish target is the top of the previous accumulation range.


