#WAVES/BTC 1W (Binance) Big falling wedge breakoutWaves Protocol just printed a morning star on weekly, downtrend seems over and priority is upwards now, targeting 50MA resistance.
PSX:WAVES #WAVESBTC #WavesProtocol #DApp
⚡️⚡️ #WAVES/BTC ⚡️⚡️
Exchanges: Binance
Signal Type: Regular (Long)
Amount: 3.1%
Current Price:
0.0000721
Entry Targets:
1) 0.0000631
Take-Profit Targets:
1) 0.0001234
Stop Targets:
1) 0.0000430
Published By: @Zblaba
Risk/Reward= 1:3
Expected Profit= +95.6%
Possible Loss= -31.9%
Estimated Gaintime= 4-6 months
waves.tech
WAVESBTC trade ideas

✳️ Waves Hitting A New All-Time Low Is A Major OpportunityYou know what I love to say, "Once we hit bottom, it is easy to experience growth."
WAVESBTC hitting bottom, February 2024, is a major opportunity for those Cryptocurrency enthusiast... Truly, when such a famous pair hits bottom, what follows is massive growth —as the market moves in cycles.
This bottom is matched by a 6.5 years long downtrend and a 4.5 years long bullish divergence with the RSI.
➖ Between 2020 and 2022 WAVESBTC grew more than 2,150%.
➖ In 2017 WAVESBTC grew more than 1,700%.
It is the same situation in which we find ourselves today.
The cycle that follows; the bullish wave that follows; the period that follows can result in massive growth.
We are looking at a potential of 500-700% if the market remains shy, which we know isn't the case looking at Bitcoin and how strong the recovery year was.
👉 We can assume that WAVESBTC can easily produce 1,000%+... But it can be much more.
We will have to wait and see but this is a chart setup with extreme low risk and super-high potential for reward. And that's just what we need to trade to win. Long-term.
Namaste.

✳️ Waves Classic Signals (700%+ Growth Potential)We are going with the most classic signals for this one, WAVESBTC.
➖ MA200 is our long-term indicator for gauging the potential of a pair. Above this moving average major explosive growth can happen. WAVESBTC is set to move above this level (black line on the chart).
➖ Double bottom. June and October 2023. At the same time the entire period from June until now can count as sideways/consolidation/accumulation.
➖ Bullish RSI. While WAVESBTC is trading at bottom prices the RSI is already bullish. A very strong bullish signal.
➖ Volume. These are the most basic yet powerful signals. Trading volume is leaning in favor of the bulls. What I mean is that we have higher volume on the green days vs the red days, overall.
👉 Here I am mapping a 700% growth potential but there can be more, long-term.
Don't take this "there can be more" lightly, Cryptocurrency tends to amaze.
Namaste.

WAVES Price Surge Alert! 📈 - Your Path to Wealth Starts Here"**Short Fundamental Analysis: Waves (WAVES)**
Waves is a multi-purpose blockchain platform that supports various use cases, including decentralized applications (DApps) and smart contracts. It was launched in 2016 and has since attracted a growing community of developers and users.
**Fundamental strengths:**
* **Simplicity and ease of use:** Waves is designed to be user-friendly and easy to develop on. This has made it attractive to a wider range of users than some other blockchain platforms.
* **Scalability:** Waves is designed to be scalable, meaning that it can handle a high volume of transactions. This makes it well-suited for applications that require high throughput.
* **Active community:** Waves has a strong and active community of developers and users. This is an important factor for the long-term success of any blockchain project.
**Recent news:**
* **Waves launches WX Network:** WX Network is a decentralized trading protocol that provides a suite of investment tools for managing crypto assets. It is governed by the Waves community and is designed to be secure and easy to use.
* **Waves integrates with XTN:** XTN is an index token collateralized by a set of Waves Ecosystem tokens. It provides a way for investors to track the performance of the Waves Ecosystem as a whole.
* **Waves continues to grow its ecosystem:** Waves is constantly expanding its ecosystem of DApps and services. This is helping to drive adoption and increasing the overall utility of the Waves platform.
**Disclaimer:**
Please note that I am not a financial advisor and this is not investment advice. Always do your own research before making any investments.

✳️ Waves Three Bottoms PatternWe have the three dips here on the WAVESBTC chart, this is analogous to the iH&S pattern.
It is very common to see three dips with the middle being the deeper before a trend reversal.
The whole chart structure and today's action is quite revealing as well. Waves is getting ready to grow vs Bitcoin as well as USDT.
Namaste.

✳️ Waves Bottom Potential (500% Potential Profits)Opportunities like this one are not seen very often... Only a lucky few, or should I say, only a few smart ones get the chance to load up at this point.
If you see the market being kind of slow, it is because there are many bottom opportunities out there.
The market is only hot at new highs, when it is the best time to sell.
WAVESBTC potentially hit bottom and this can mean that a long bull-market is set to follow. This can translate into years of growth... It might not happen but look back at December 2019, now we have a lower low.
Opportunities like this one are not seen very often.
Wishing you success, profits, health, wealth and good luck.
Namaste.

✳️ Waves For An Easy 100%+ Vs BitcoinOk... I had to get out of my way to get you this one. I was thinking I should show you something different.
Everything flows naturally when I am working/writing, I don't have to think of anything everything comes out of its own but I broke the flow to bring you this pair, hopefully it will turn out good.
✔️ Bullish MACD and RSI.
✔️ The volume is quite telling.
✔️ The candles are quite telling.
✔️ The bullish bias is strong.
The potential is there for an imminent bullish jump.
It started the day full green, it normally goes ahead for multiple days before losing steam.
So now, we wait and see.
The support/stop-loss as usual is marked blue.
The targets are clearly seen as green.
The potential is on the title.
I like it when I get good results.
I don't like it when I miss.
Namaste.

✳️ Waves Goes Bullish (Easy 80-100% Potential)Same as with IRISBTC, Waves managed to conquer EMA50 yesterday and started the day green.
✔️ We have a very strong RSI after a lower low with rising volume.
✔️ We also have a broken downtrend.
This bullish action is just getting started.
The Altcoins vs Bitcoin pairs (ALTSBTC) are set to grow/recover until the next Bitcoin breakout, which should happen within a month as shared in the last BTCUSD trade idea/analysis.
More details on the chart.
Everything will grow.
Patience is key.
Namaste.

waves going to die 0waves going to die 0. 13 mounts losing x20 btc pair and still down.. it will be delist on binance..

BUY WAVES/BTC to go to the moonNothing to say about waves in bitcoin pair, the chart says it all. Currently all the way down to support , high potential to the upside, buy and hold for a amazing ride.

#WAVESBTC - Potential for 30% Coming Off Fresh RejectiontheCrypster -
After a generally downward trending scene with #WAVES for the last 11 months or so, mostly trending along the top edge of this channel we've attempted another top edge break, and got rejected again!
We've attempted a lower edge breakout only a couple of times and the most recent swing low is where we're going to be putting our Take Profit on this one. Around 30% is a very healthy trade!
If you enjoyed or agree with this idea - drop us a comment, like & follow! :)

Waves btc Start break out watching the outcome ,failing wedge sure we will have great performance potential for 1x

✳️ Waves Hits Its Lowest Price Since December 2019...Once we hit bottom, the only place left to go is up... And Waves hit its lowest level in three years and the bounce that is taking place is super strong.
In late December 2022 Waves went as low as 0.00007650, a level that was last seen December 2019.
We are looking at Waves vs Bitcoin (WAVESBTC).
Of course, this is good news... The lower it goes and the faster it drops the stronger the rebound.
We can see 47% happen in the short-term.
173% and 295% can be done, it is possible, in the mid-term.
Long-term, we have over 400% potential when we consider the March 2022 high.
Since we have a higher low, we can expect to also see in the future a higher high.
If I were to do the maths, the total potential would be a thousand percent or more... I will leave that for later this year or maybe in 2024 when the bull-market is in full force.
Namaste.

Waves vs Bitcoin Also Bullish (130% Potential)We looked at Waves vs Tether (WAVEUSDT) and how it hit its lowest price in 2 years, we also have early reversal signals.
For Waves vs Bitcoin (WAVESBTC), we have something similar.
First, the low set is the lowest price in more than 2 years.
And we have the early breakout signals based on candlestick reading as well as a strong RSI at low prices, increasing volume so on and so forth.
The bottom line is that this altcoin pair is all ready to switch from RED to GREEN.
Namaste.

$WAVES bullish against $BTCProbably one of the only bullish charts against $BTC. Good to keep an eye on and look for the breakout.

WAVESBTC 4HWAVESBTC built a bullish pattern characterized by the uptrend line, and managed to hold its support at $0.0002266 which despite this widening in this region soon outruns the cloud and heads towards the upper base of the LTA. Our target of $0.02400 is exactly that point in the upper base of the channel. Good prognosis, we hold the position.

WAVES/BTC 4HWAVES/BTC = Forming a triangular figure, the upper part is without slope and the lower part with a sharp slope which indicates a triangular figure with an ascending character. After crossing the upper keltner line and the narrow cloud band, it arrives at our target of 2400
Waves is a blockchain platform created to launch smart contracts and smart assets.
It was created in 2016 and has maintained its position among the 100 most popular cryptocurrencies ever since. Waves Exchange and Neutrino Protocol are two of the most successful platforms built on Waves.

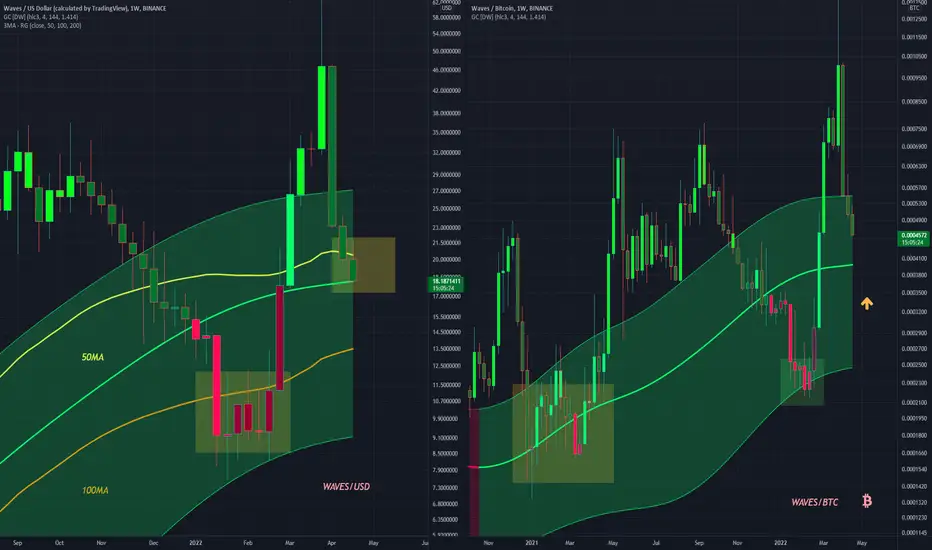
WAVES 50MA Attempt? WAVESUSD is approaching the 50MA on the USD pair, this will likely be a place of support as it coincides perfectly with the middle Gaussian Channel Band
The BTC pair also seems to want to recover at the middle band, likely because it has been previously a place of support
WAVES BTC Falling wedge, and ascending RSI.
WAVES USDT looks bearish tho, I would rather wait for a break out

WAVES BTC longSo WAVES/BTC is sitting on daily EMA200 + weekly EMA36 , both have been always a strong support and as the chart is shown, those level were followed by a strong bounces almost every time they were tested. Also from the recent move, WAVES/BTC is sitting at 0.786 FIBBS, this is a good level to buy at.
I would wait for a bullish divergence on lower time frames to take the best possible entry.

Potential Waves/BTC Long trade.Been buying back into Waves again within the golden pocket, after having DCAed out of my position during the recent significant pump.
Price have now just broken out above the sym triangle as defined by the cyan dashed lines. Presently setting stop loss below the 65% line, just below the golden pocket.
WIll revert to a trailing stop loss strategy if the price successfully bounces off above the sym triangle, and above the ca. 0.000687 BTC range.

WAVES formed bullish Shark for upto 103% big pumpHi friends, hope you are well and welcome to the new trade setup of Waves coin with Bitcoin pair.
On a 4-hr time frame chart, WAVES has formed bullish Shark .
Note: Above idea is for educational purpose only. It is advised to diversify and strictly follow the stop loss, and don't get stuck with trade

Waves Goes Beyond May/Sept 2021. High | Next Target...This is a very important one... Thank you for reading.
Waves vs Bitcoin (WAVESBTC) has broken above the May and September 2021 peak price, hitting a new high today.
What does this mean for us chart readers and cryptocurrency traders?
This is great news because the entire market is connected/linked; what one group of Altcoin does, the rest tends to follow.
Seeing Waves, which moved ahead of the pack, go beyond its 2021 peak price can signal that the rest of the Altcoins market will also do the same.
The next high/peak price was set around December 2018... These are the prices that are going to be challenged next.
Did we read the charts correctly?
Did we predict that this was coming your way?
Sure thing... We were expecting long-term growth for years to come on the Altcoins, higher high and higher lows and Wow... This is great.
The bears had their party it is now the bulls turn.
Previous chart: www.tradingview.com
Thank you for reading.
There will be more.
Namaste.
