Waves splashing profitsExpecting some volatility with tight BB. I am predicting the support will hold and we'll get a nice bump.
WAVESBTC trade ideas

WAVES BULL ALERT WAVESBTC -Long & Short
4 hour Technical Analysis
Waves has retested it’s previous Support level experienced in January at 1068, It’s bearish move to 1181 (temporary support level) twice yesterday was a good indication of rare chances of downward action below it’s support level.
The same Golden cross in December and February is about to experienced again and we might see waves get close to it’s Resistance at 1368 by 4th of June. If waves breaks that resistance get ready for 1753.


Easy +10% Wave to RideQuick little 10% gain that looks primed for a little bounce action.
If BTC makes another move for $10K or drops +2% in an hour Alts will suffer.
Chance to see this set up again if downtrend continues to the next support level.

WAVES/BTC (Old Support --> New Resistance?)WAVES/BTC
-the bearish market structure on the daily
-but manages to find support from the previous history
-I'm expecting the price to retest the lower box resist
-if unable to break the resistance at 1371s
-we might see another downward action
-and confirmed the continuation of the bearish scenario

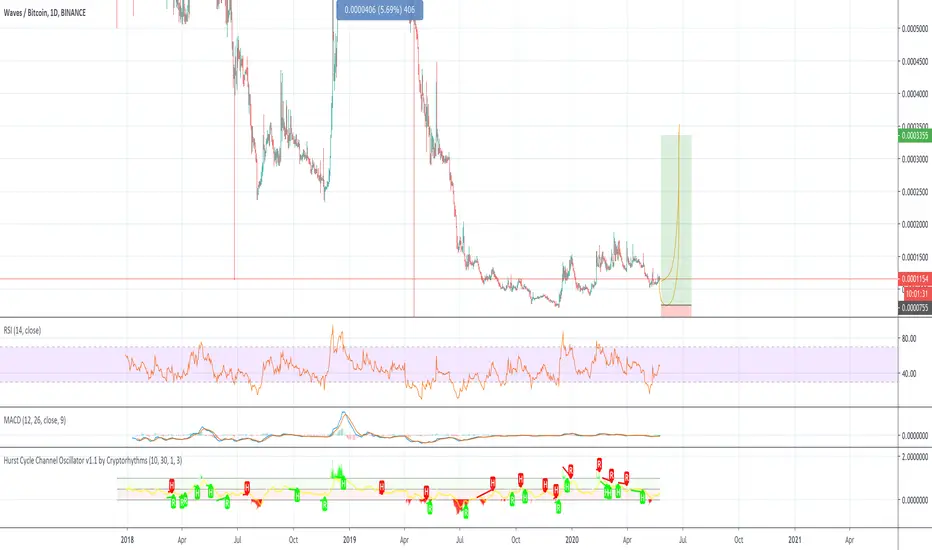
WAVES undervaluation period may be finally endingHello to everyone!
I guess the chart is self-explanatory but let's do this by the book.
I'm expecting strong price rebound for WAVES in coming months. Usually charters focus more on the price than on time in their predictions but here I'll try to do both. In 3 months or so the price of this asset may be way higher. By August 1st price should be above 45k sat and this will be only the first stage of a bull run followed by a second one by years end (above 100k sat). That being said new ATH in terms of BTC won't happen this year - more likely in 2021 (if ever since it depends on BTC and general sentiment towards crypto in general) and it won't be so easy to achieve. Buckle up!


WAVES / BTC : LOOKING FOR BUY IN SHORT TERM AS PER ELLIOTT WAVE THEORY , WE HAVE COMPLETED THE 2 ND WAVE NOW 3RD WAVE IS RUNNING !!

WAVES is about to enter Support | 58% Do Like If you are holding WAVES
Price action is clearing the Next Possible Support Level.
Rising Wedge Target is marking the Support area which is supported by Previous Trendline.


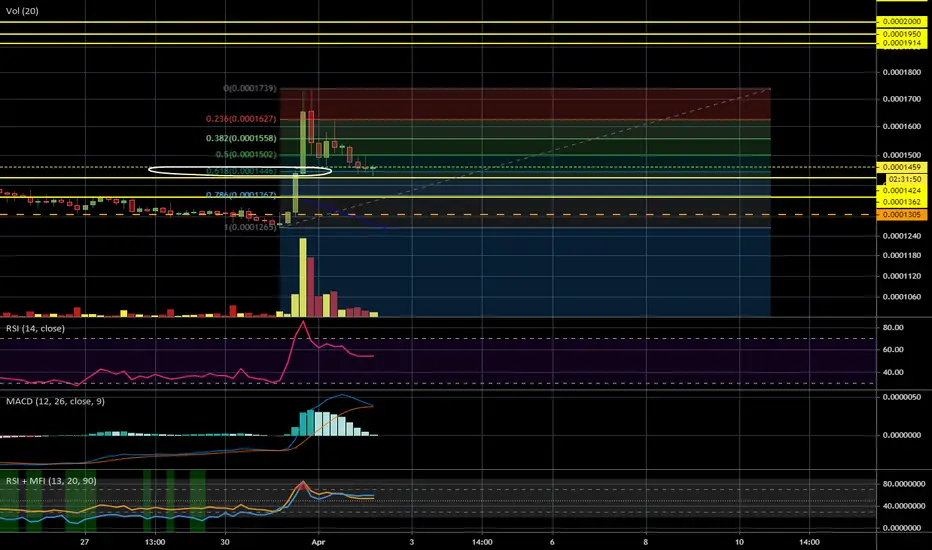
Waves boiling kettle.What we can observe now on the chart is very careful but clear reaccumulation after the bounce from the bottom.
The lid on the kettle is starting to jump as this process is almost complete ale price ready for new highs.
Here are some factors confirming that:
-almost all EMAs are condensed within narrow price range which will serve as a strong support in coming months
-we are approaching the support of rising channel
-dynamic upward spikes are getting hard to control and it looks like it is really easy to go up from where we are now
What is to be expected in coming weeks?
I expect the price to move swiftly over 25k sats after this lengthy consolidation ends and Golden Cross will be the main trigger. As you can see on the chart it can happen very soon as the structure tightens and becomes too obvious to ignore. Short term speculators will push this up hard after the move is triggered. It may be easier to miss the move than you think so for those hoping there is plenty of time to enter the trade you better watch Waves carefully.
This is not financial advice.

WAVES: Slowly climbing upFor those who've forgotten, LPOS blockchain platform for dApps. One of the few crypto projects that shows signs of life does not look like a zombie.
Short analysis:
Waves is slowly climbing up still, roughly about +0.7%/day. Looks like some kind of relief rally or rising wedge on daily, I not a fan of patterns tho.
Just observing, have no plans to touch this, until it reclaims 0.00025 level at least. Or if bitcoin will suddenly become mega bullish (not pathetic-$200-swings-bullish, but MEGA bullish) - it will be one of the candidates for a buy.
Hit the "LIKE" button or sign up with my ref links below to support, thank you.
Information is just for educational purposes, never financial advice. Always do your own research.

WAVES/XBT moves down to test support for the third timeKRAKEN:WAVESXBT , which has recently been in a conservative upward trend, is moving down to test support for the third time. Given the bigger picture of the general trend, it is expected that WAVES/XBT will deflect upward after testing support.
Keep in mind, however, that the cryptocurrency space as a whole is looking rather bearish, and this does have a real chance of throwing off the current bullish trend in WAVES/XBT.


WAVES / BTC 4 HOUR SHORT CUTWaves looks ready for leg 2, bounche on the 0.618 fib, Bullish hammer, volume dropping fast bearsh divergence played out
Keep an eye on this one mates!
WAVES/BTC yesterday trade analyses.Hello traders,
In this video I will report our yesterday trade that we book some nice profits, and showing the strategy that we follow to make this quicky and easy trade.
Please hit the like button and follow us on Tradingview.

Waves Will Test EMA300 Next, See InsideWaves (WAVESBTC) just tested EMA100 as support and is now aiming at EMA300 or 0.0001785.
Depending on how this level is handled we can determine the next step.
We are looking at about 19% from the current price to our target. Prices can go much higher of course and hit the upper trendline of the ascending channel... WAVESBTC is looking really good.
Thanks a lot for reading.
Namaste.

WAVES/BTC (Resume uptrend?: up to 45% profit)WAVES/BTC
WAVES may have temporarily found support at 100D MA and ascending trendline support at 1290 sats area.
If this is the new higher low, our target is the swing high in the 1877 sats area.

