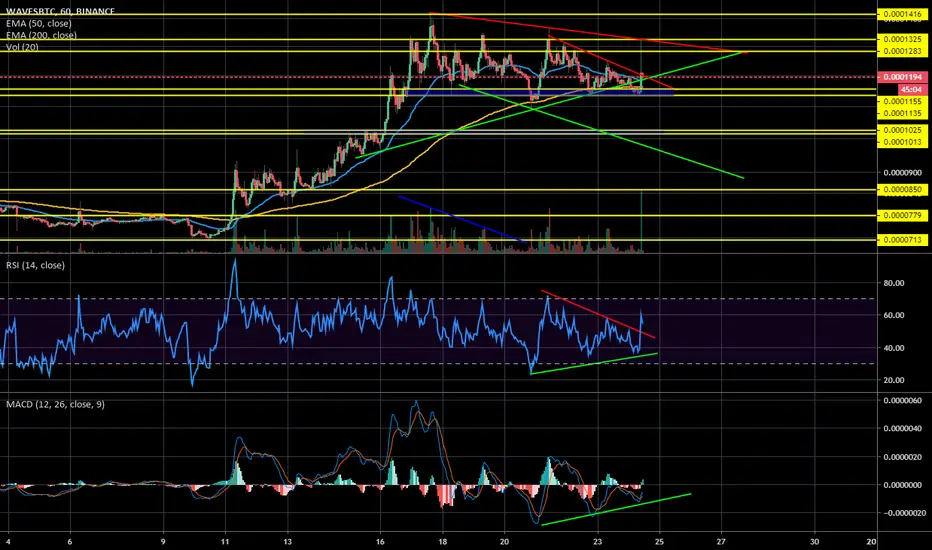
HOLY FACK, HOLE IN MY ROOF WAVES / BTC 1 HOURSo, I got an hole my roof by that canlde, massive rihno bar!
* Look at that 1 hour candle, big bull candle but sold of for more then 50 %. Bad sign.
* Biggest candle of hte hole run up!
* Structure still good but needs to hold support!
* Golden cross still in play, that's fine
Lets see what will happen next days
WAVESBTC trade ideas
WAVES / BTC 4 HOURWAVES:
* Nice RSI trendline on the 4 hour!
* Volume is dropping vast!
* Looks a triangle is forming.
* The slope of MACD candles slow less bearish potential.
Hoop that Bitcoin is nice today

HOLY SHIT, THESE WAVES RIHNO'S ARE ANGRY AGAIN! 4 HOUR!Hey Waves man, easy, easy..... Allright, lets talk about the chart, there happen al lot!
* MACD moving averages tries to cross bullish on the 4 hour!
* Good response of the RSI trendline! nice Bounce!
* Also the 50 EMA has support the price, it looks everything comes to gether!
* Golden cross in play, good.


WAVES could go up 4 %There is a strong resistance that could lead to a solid bounce in the next few hours.

LETS RIDE THE WAVES! 4 HOUR ARE THE SOME WAVES RIHNO'S IN DA HOUSSE?
* It looks like an bull pennant consolidation has formed! Volume is dropping so, thats the case.
* The red bars of the MACD are cooling down!
* The RSI is showing that the bearish momentum is slowing down.
* Price action is also slowing down!
* Golden cross in play, thats a real bullish signal!


Head And Shoulders Created for WAVESBTC Binance.Head And Shoulders Chart Pattern create for WAVESBTC coin for recently hourly timeline. Isn't a good time to enter?

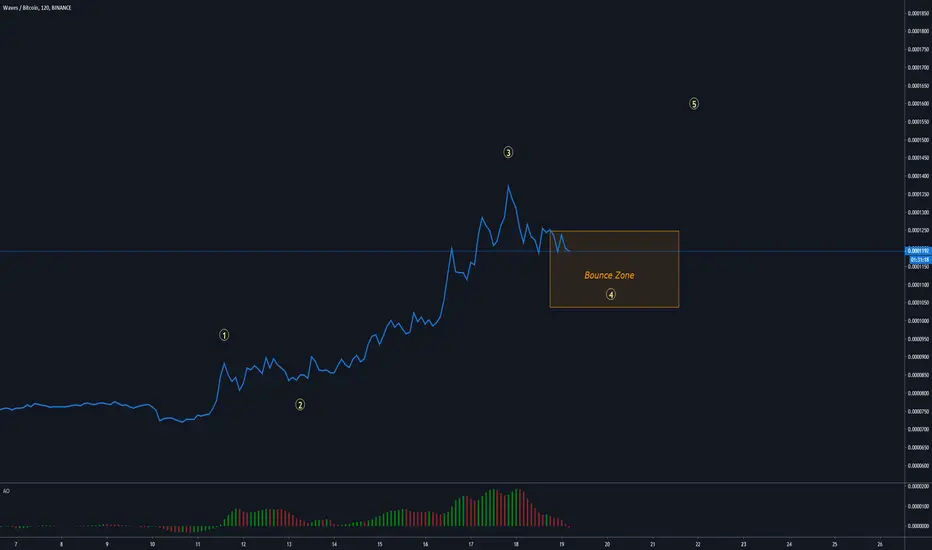
Expecting A Bounce Higher...Wave 4 can complete anywhere in the box marked expecting 1 more move up from this area.
WAVESBTC forming bullish BAT | A good long opportunity aheadPrice action of Waves / Bitcoin is forming a bullish BAT and soon it will be entered in potential reversal zone insha Allah.
This PRZ area should be used as stop loss in case of complete candle stick closed below this area.
I have used Fibonacci sequence to set the targets:
Buy between: 0.0001172 to 0.0001154
Sell between: 0.0001214 to 0.0001277
Regards,
Atif Akbar (moon333)

$WAVES Am I being to optimistic? HaHaHa$WAVES is a big IF......IF the volume comes as it was on the previous run...maybe we can see a huge move!
Let´s see if the projected yellow candles became real !!!
Remember, this is not a financial advise, just for educational purposes.
"fingers crossed"


Waves Prints Massive Volume | Huge Potential Ahead (130%+)Waves (WAVESBTC) printed three massive green volume bars in the past three days... This is the highest volume we've seen since July 2019.
We also have a break above EMA10 and WAVESBTC now trading above EMA50. The EMA50 break needs daily candle closure for confirmation.
The RSI is strong while the MACD is showing bullish divergence and allows for additional growth.
With many altcoins doing great numbers and these signals, we can easily say that Waves will grow if it remains trading above EMA10 at the least.
Thanks a lot for reading.
Namaste.

Waves Can Easily Grow 30% Within Days | 80%+ Longer-TermWaves (WAVESBTC) is now trading above EMA50 (0.0001124) and is ready to grow.
All the details can be seen in the chart above.
We can see a massive break of EMA50 since there is no volume nor long wick... A "passive break" of resistance usually means that the momentum will come later on.
The MACD is on the bullish side. We have been seeing the MACD bearish for quite a while, since February it was below 0, now it is above which is bullish.
The RSI is strong at 60 and moving above all resistance, can easily move higher.
Conditions for change
If WAVESBTC moves down and closes below EMA10 (0.0001089), then it has the potential to test the last low at 0.0000959. The next move depends on how this level is handled.
We are bullish on Waves.
Thanks a lot for reading.
Namaste.

WAVES / BTC 4 HOURWaves? Tsunami you Mean!
Well, that was an big uprun! But now this is what I see:
* RSI on the 4 hour still support the price
* Bearish devergne on the 4 hour
* MACD looks its momentum loosing his aggression.
* Slowly loosing volume
* Last 2 candles are bearish.
Be carefull!

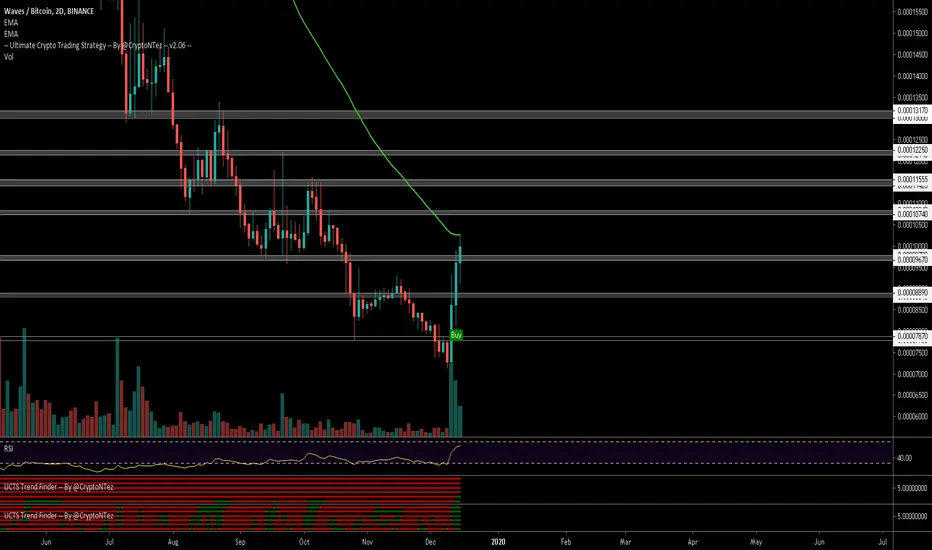
$WAVES, Showing UCTS buying signals on the 1D & 2D charts$WAVES
Showing UCTS buying signals on the 1D & 2D charts w/ a nice recovery from ATL BTC level (40%+)
Zooming IN:
We can aim for a safer entry on a potential flip of the just crossed ~9.6k sats
RSI reaching overbought/Volume showing good levels
Partial targets on picture
#WAVES
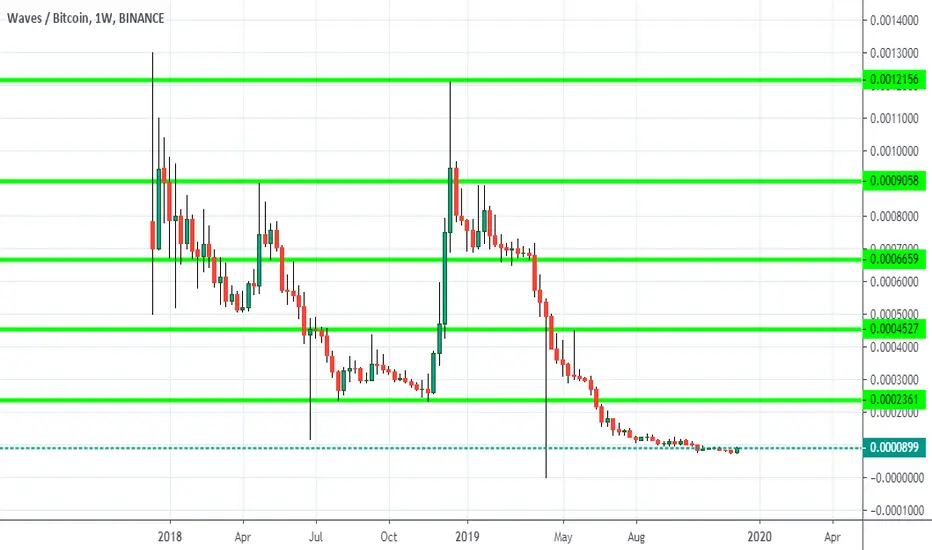
Waves shows some signs of liveWaves first positive signs after a very long descending channel...lets hope it continues a little!


BITCOIN BTC/ WAVES REVERSAL We notice a reversal move on BTC/WAVES
The price has just broke out from the Ascending Triangle Pattern.
We look after the MA's 50 and 200 that may cross and become a Golden Cross thai is very bullish sign.

Ride on WavesWaves has started an uptrend since a downward pitchfork has broken up. Huge Ichimoku cloud is ending and finally forming a position under candles which is another side of bullish sign. I see volume is great and if we consider Waves move on last December, people would use a Mask of Madness and pump it a lot ! I highlighted short terms targets on the chart which are so available !

WAVESBTC 4HWAVES made breakout, there is divergence for now, it may minor correction but i think would move on the rising wedge.. Break a leg!
