WAVESBTC trade ideas

WAVES / BTC 4 HOURWaves, You look simular to TOMO. TOMO have a big breakout at this moment.
Waves:
* Make an ascending triangle.
* Volume is dropping fast
* If the price start to rise a gold cross is on the corner!
* around 100.000.000 coins in play almost the same as TOMO.
* Slowcaps breakouts are very brutal in compare to large caps.

$WAVES, Trying to break from ascending triangle..$WAVES
Trying to break from ascending triangle after showing great volume over the last 48hs..
You may want to aim for a R/S flip as a safer entry..
UCTS Buy signals across all TFs (12H and lower)
9.6k - 10.7k sats as targets..
#WAVES

Incoming move for Waves/BTCAt the retest area at the moment and it might be a good buy here for a move up. I'm expecting atleast to hit 10 before we move down a bit again.


WAVES/BTC 15m (Binance) Forming bullflag & ready to bounce againLooks like the resistance at 0.0000828 BTC is holding that retracement.
Keep on eye on that possible breakout or leave a Stop Market Buy!
Entry= 0.0000860
Take Profit= 0.0000921
Stop Loss= 0.0000799
Risk/Reward Ratio= 1:1


WAVES/BTC TA Update (Early Sign of Trend Change?)WAVES/BTC
WAVES is starting to make a move with this bullish candle,
but can the price closes today above this trend-line of resistance or 50 Day MA?
We will have to find out in the coming days if potential trend reversal is on the way.
It is still too early to provide a buy signal because this can only be a fake-out.
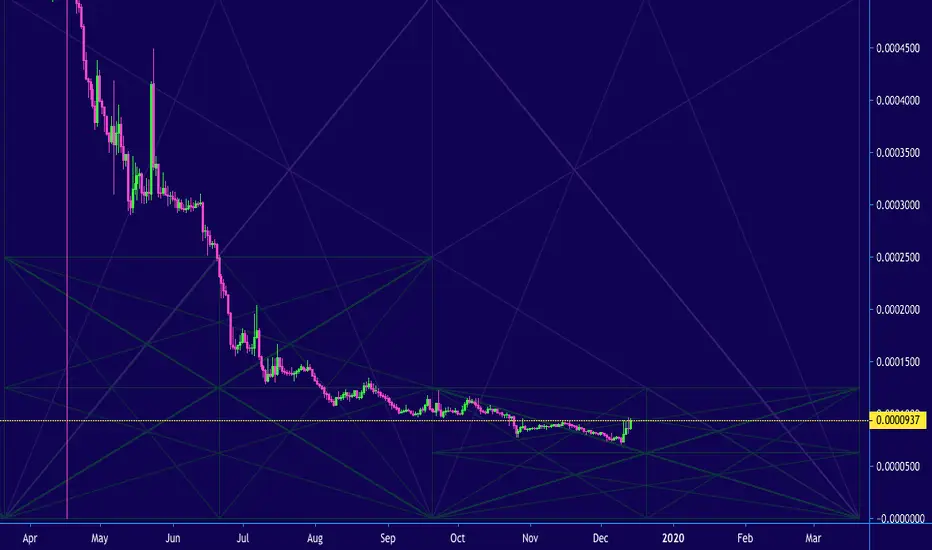
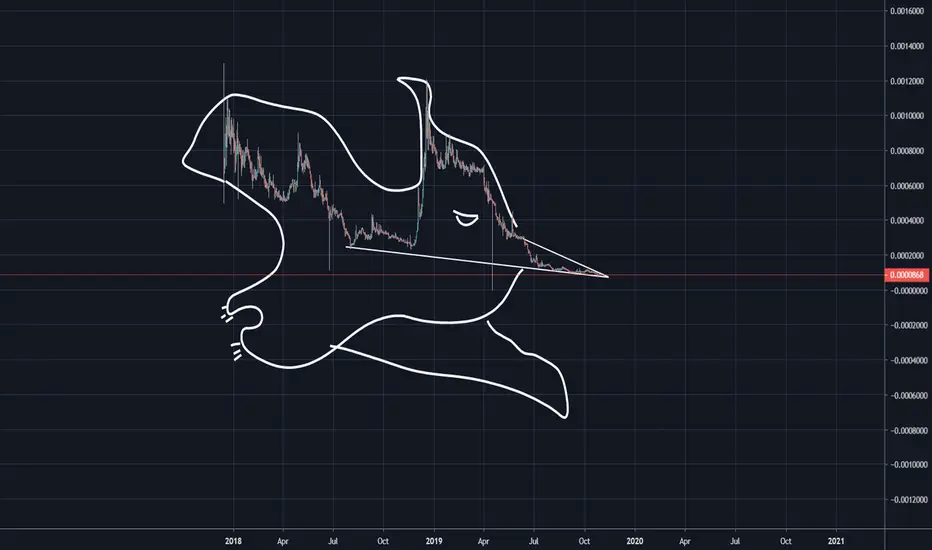
WAVESBTC Stuck in downtrendRetest of the 0 fib line may lead to a bull run bounce, hence the fractal. Otherwise the downtrend will continue along the 0 fib line.

WAVES/BTC 12H (Binance) Falling wedge fakeout and back, uptrend?WAVES is getting ready for uptrend, don't miss that opportunity to enter with BTC for mid term.
Plus, it's a Russian technology and Ruble (RUB) trading pairs have been added in Binance, could be the cause of the recent pump in lower timeframe!
Entry= 0.0000740 - 0.0000760
Take Profit= 0.0000799 - 0.0000849 - 0.0000899
Stop Loss= 0.0000699 or less
Risk/Reward Ratio= 1:1 - 1:2 - 1:3
I will publish a weekly analysis later for long term where a huge falling wedge is forming with USDT...

Waves btc going lowerExpecting a last leg down before a reversal. Look for a bullish volume spike in the green box on the chart if it does go lower and go long.


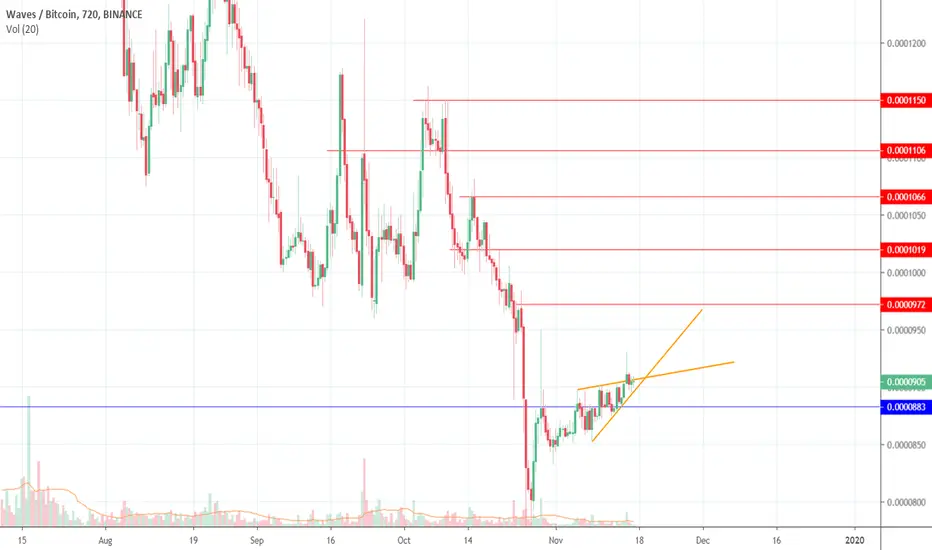
Today`s ALT!!! WAVESBTCBINANCE:WAVESBTC
Exchange : Binance
Coin: WAVESBTC
Buy Zone: 0.0000915~0.00009
Target Point: 0.000097/ 0.0001015/ 0.000106/ 0.00011/ 0.000115
S/L: 0.000088
Risk: HIGH
Term: Middle
You should be careful in buying WAVESBTC because of Bitcoin
It broke up Rising Wedge with Pumping
Retracement of Pumping stopped at Short Up Trending Line
The Chart and RSI have same Up Trending Line
The Volume is almost down
It`s time to be pumping !!!
=====================================================================
Today`s ALT is that information is raised regardless of the Coin market situation
So sometimes there`s a high risk trading
Investment is your responsibility.
I'm just providing about coin`s information
=====================================================================
WAVES Double Bottom WAVES was farmed double bottom at 778 sats. Uptrend closed above EMA 21,50,100 periods. Potential retest EMA 200 at 921 sats and 0.382 fibs level 947 sats.
Was hold above green support line.
Volume: of buyers increased, confirm bullish price action.
Indicators: MACD bullish crossover above zero line. RSI above 50 points. Bullish sign.
Pattern: Double bottom at 778 sats.
S/R: Support at 850 sats, Major Support at 778 sat, Resistance at 950, Psychology Resistance 1000 sats, 0.618 sats Resistance at 1051.
Disclaimer: THIS IS NOT FINANCIAL ADVICE. All the information shared here is for learning and entertainment purposes only.


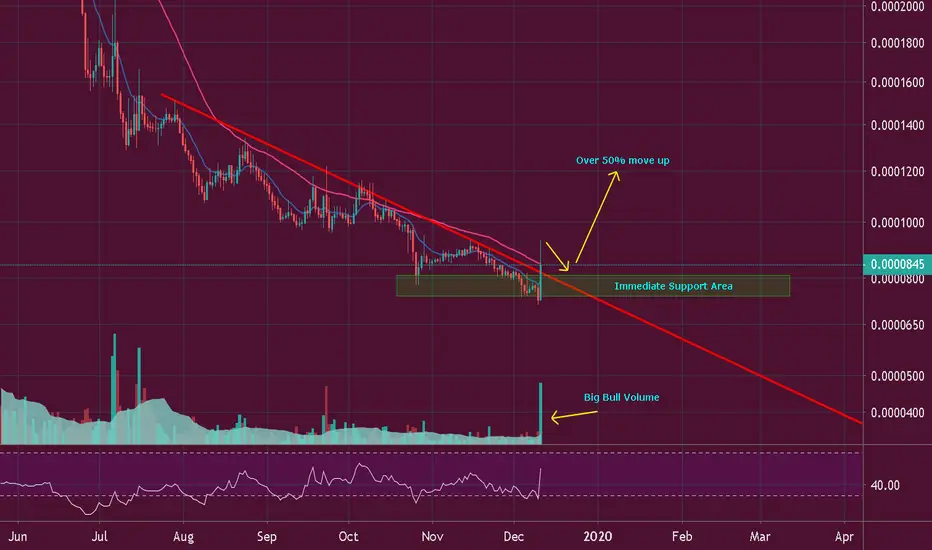
Updates on WavesNew update the current situation of Waves is here !
Good volume is coming daily and bottom is forming right now. 972 Satoshi is available within days and 1k+ Satoshi is short term target. For longer time periods if price could break 2600 Satoshi area, we may see another heavy bullrun like last February for Waves ! Zoom out for upper targets .


#Waves Preparing For Parabolic Moves 1200 % Profit AheadWaves Can Go Parabolic From This Point News Incoming December 2 Waves DEX Converts to Waves Exchange Fully Hybrid Exchange First Of Its Kind !
Buy Zone: 880 - 900
Sell : 12k - 20k - 32k - 44 - 120k

WAVES Hello, Traders!
Monfex is at your service and today we overview WAVES/BTC .
WAVES one of the losers these days, but we remember that marketmakers stand by this coin and at this chart we see the descending channel and the price is going to the bottom line. Also we see it's a bullish divergence by RSI and we can suppose that near the previous low will be rebound to the resistance zone.
Supposed Trade Signal by WAVES/BTC
Buy near 0.0000890
Take profit ~ 0.0001034
Stop loss at 0.0000825
Market Cap
$70 561 361 USD
Volume (24h)
$14 900 668 USD
Circulating Supply
100 143 784 WAVES
Share your thoughts, ideas about the market under the chart.
Watch for our Updates to be the first who gets well-timed signals !
GOOD LUCK AND LOTS OF PROFITS !!
Disclaimer
This report is for information purposes only and should not be considered a solicitation to buy or sell any trading assets. Monfex accepts no responsibility for any consequences resulting from the use of this material. Any person acting on this trade idea does so entirely at their own risk.
