WAVESBTC trade ideas

Waves / Bitcoin (WAVES/BTC): Supports, Pivots & Resistances>> efcindicator.com (Special Discount) Find Winning Trades In Seconds
Waves / Bitcoin (WAVES/BTC): All The Supports, Pivots & Resistances – Short-Term

$waves news pump inboundwaves have the ultimate bull plan for January 2019:
Binance New WAVES Pairs
Coinsuper Listing
VST Airdrop Announcement
Bounty program
Blockchain Gamer Connects
Partnership Announcement
See - coinmarketcal.com
if waves can close the day above the 21 ema then the targets set are achievable its just how high the news carries it!


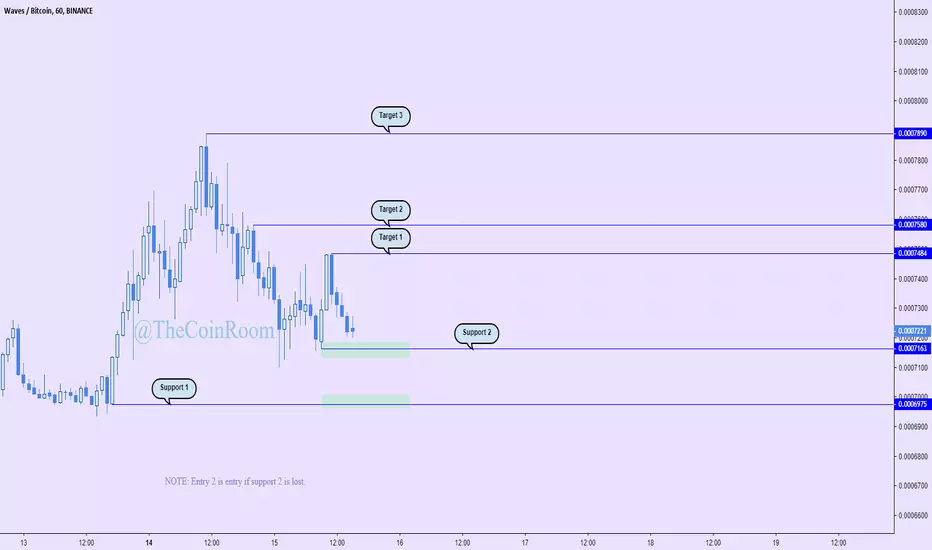
WAVESBTC Trade SetupShort-Mid Term Trade
-> Accumulate in the given Buy Zone
-> TPs at the Blue Lines
-> SL at the red line


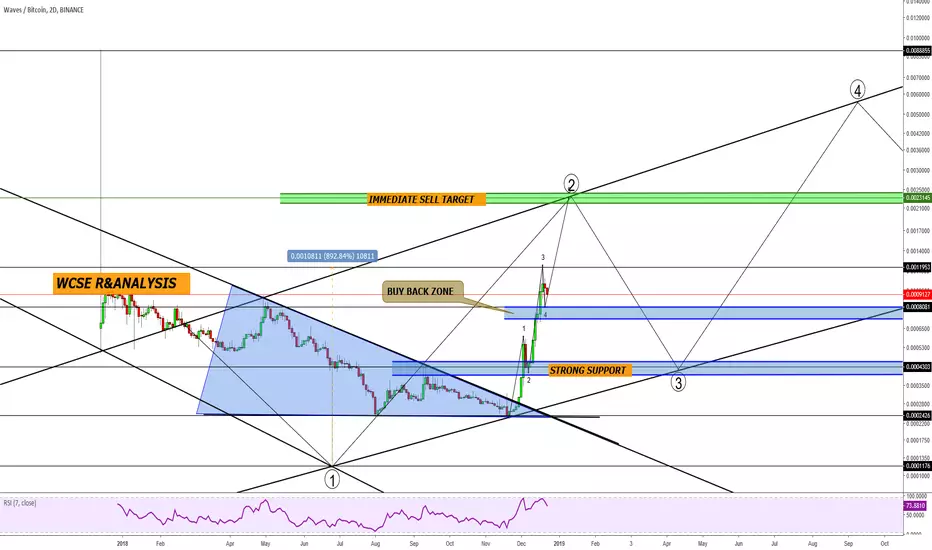
WAVESBTC Trading opportunitiesHi guys sorry for taken so long to respond to your Waves request.
Yeah the beast mode had been activated after the yearly low was hit far back in June 26th with price at 0.0001176.
Since then the price had been rising.
Right now we still has more room ahead as correction to is over.
Follow our suggested entry price to add more bags.
Possible Entry and exit targets are clearly stated on the chart.
BLUE: POSSIBLE ENTRY ZONE
GREEN: SELL TARGETS
Join our discussion room for more about our trading ideas.
Please share your thougths about it and support my post with your LIKES.
Thanks


Waves : 70% profits opportunity in the mid term.Falling Wedge creation and at the verge of confirmation for the next move - whether further downwards or an upward breakout.
Mid Term Trade Accumulation Recommendation
Accumulation Area : 69500 sats - 71000 sats
Distribution Targets
Target 1 : 81590 sats
Target 2 : 89000 sats
Target 3 : 94980 sats
Target 4 : 100970 sats
Target 5 : 109490 sats
Target 6 : 120550 sat
Stop Loss : 55000 sats
* RSI very low at 20.
**Volume needs an increment to see a breakout.
***50EMA and 89EMA still needs to come lower than the price.
****A close above the falling wedge can be seen as a rebound from the support and confirmation for a long opportunity.
Good Luck.
Legal disclaimer:
Information on this channel is our team's analyst's "opinion" based on data available at this point in time. These opinions are not recommendations to buy or sell securities/commodities and cryptocurrencies. Trading and investing is a risk and you should not rely on this data to make any financial decisions. You must consult a financial advisory licensed by regulatory agencies in your legal jurisdiction. All information stated here and in our reports don't guarantee any possible profits or losses. Please do consider to do your own due diligence and research when making any kind of a transaction with financial implications.
With Regards. TeamTWA.
You can give us your feed backs and suggestions on our effort in addition to this your questions here in trading view or in our telegram channel by the same name togetherweaccumulate.

waves bounce from before still in playstop was likely too tight in last waves post, but held up strong in spite of btc dump, maybe has another leg up in it if not at least a dead cat bounce

Waves is about to break the downtrend and can be a great moment.Price hold on .50 fib and is trying to break above the downtrend.

WAVES -WAVES seems to still be under the ichimoku cloud on most time frames. If you look back at the past it has rarely ever broke through the ichimoku cloud. In this market I do not suspect it to do so.
-On the contrary, there does seem to be people accumulating this one based on the volume and falling wedge starting to form.
Overall, I do not expect huge gains from WAVES currently. At the most, we may see a 10% increase.
Twitter:https://twitter.com/CryptoNail
Discord:https://discord.gg/EUGmcHx


waves/btc 60min bull div. i see a bullish div on the 1hr chart on a key support , over sold reading on 4hr chart .. for now we should see a retrace to 74- 75k satoshi and possibly retest support before a full breakout ..
