WAVESBTC trade ideas


Its hard not to stay LONG. I have follow Wave for some time now and man ... :)
Lets look at that wave :) Price history and most indicators shows us that its should go for another rally but, Look up my chart and I'm potentially seeing Buying Climax ? Also It did hit Previous High Resistance area twice . Im thinking small pull back here to 9K area and we go from there . Or it will just rally to new high and I'm missing stuff out .
Would like to know what you think ?
For now I'm out.


Trying to find a support that holds... Trying to find a support zone that holds after a 175% run from the BUY signal that the Ultimate Crypto Trading Strategy gave us on November 30.
I have drew resistance & support zones.
Once it finds Sup and bounces we can test highs again, staying above Ichi is key

$WAVES Bullish Count.
Perfect 1,2,3,4,5 impulse waves, and ABCDE Triangle waves.
Let's make the trend continue :)


WAVESBTC one more buying opportunityThis is one more buying opportunity by waves as it has entered in buying zone of a bullish BAT pattern insha Allah.
Regards,
Atif Akbar


WAVES: Next Bullish Waves are Coming !! Buy Above Given Chart or
You Can Also set Own Risk reward.
Let see what Will be Next Move.
Warning- I m Not a Financial Advisor this idea Only For Educational Purpose Only.
Thank You !!

WAVES/BTC Finding support areas ? Hello .
Looking on Waves and I can see some potential support areas creating . If you followed I'm still short over all as we still are following this wedge and my entry its lower . But On balance Volume its holding up even with price drops makes me believe that Waves has potential to go for the run OR people are holding old bags from up movement and didn't sell on time and thats why that hold . Witch I believe its the case and will see how that behaves when we go little lower ,

$WAVES - Long Idea- If your looking for a long on Waves this is where it will bounce or die as far as im concerned for the short term.
- This is only an idea as no bullish reversal is relevant yet!
- Would be looking at partial profits at yellow line
- your trades are your own.


BTCWAVES Possible CorrectionOnly If we go below Red Line, we may see pretty good opportunity for good bounce around 24% profit
We have strong .61 fib and a horizontal support
Trade on your own risk and always look for the BTC


Waves bullrun can go aheadWaves looking powerful and bullrun can go ahead. if it breaks 10000 it can go to 20000 sats. Btc price is important and if btc goes more down Waves can test fib 618 level (7100 sats). Not a trade advice.


WAVES/BTC Head & Shoulders ? Hi,
Here what potentially can play out . With BTC staying strong can we have another run . Yes potentially but look on the chart and decide for yourself .

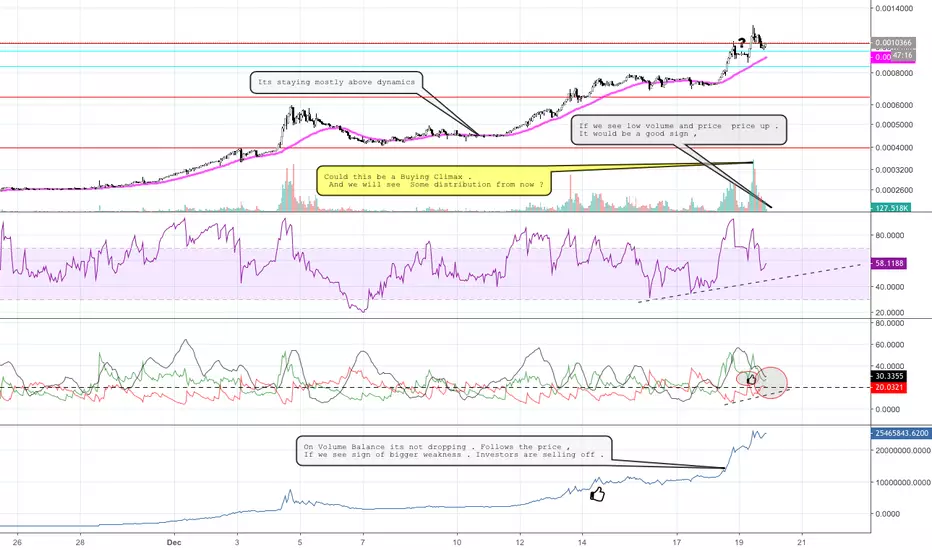
WAVES/BTC Update . Hello Wave riders .
I posted yesterday my idea and sure there was some meat left on the bone ;) . We did go and hit same high again and drop back . As you can see on my chart Looks like we are loosing demand and sell off on second Rally was large. OBV finally its slowly correlating with RSI. 15M its getting strongly rejected. With that being said I'm going to wait for retracment and watch indicators on closer time frames for SOS.
