WAVESBTC trade ideas

Waves big potential now! another coin on Consensus...
Hi 14-16.May is big event Consensus 2018, today few coins, which have some talk on this events go up fast, so in wednesday is there few coins with big potential for grow up.
Waves last months grow up from 54000sat to 76000sat, now is possible another big impulse in Consensus.
Ichimoku confirm big uptrend, break cloud, and conversion line and based line turn trend
Stochastic looks great
Volume is good
My target is about 90000sat
Thanks for comments, likes and follow.
I appreciate it

Waves/Btc Possible LongNo higher highs on the price but higher highs and higher lows on the RSI. SL is placed just below the support level, with TP at the next resistance line. Big questions to ask however, as this can easily be prevented due to any surprise movements that Bitcoin may make.


For testing my chart only- WAVESHigher low RSI.
As wave 3 completed with high 261.8% (89630 sats) , so wave 5 possibly could reach 1:1 of wave 3 at resistance around 96000 sats,
and also can be fail to reach only 261.8% around 89630 sats.


$WAVESBTC long#WAVES / #BTC
Trade summary :
BUY : 0.00080
SELL Target1: 0.0011
Stop loss: 0.00075
***************send me a msg to join my telegram group*********************


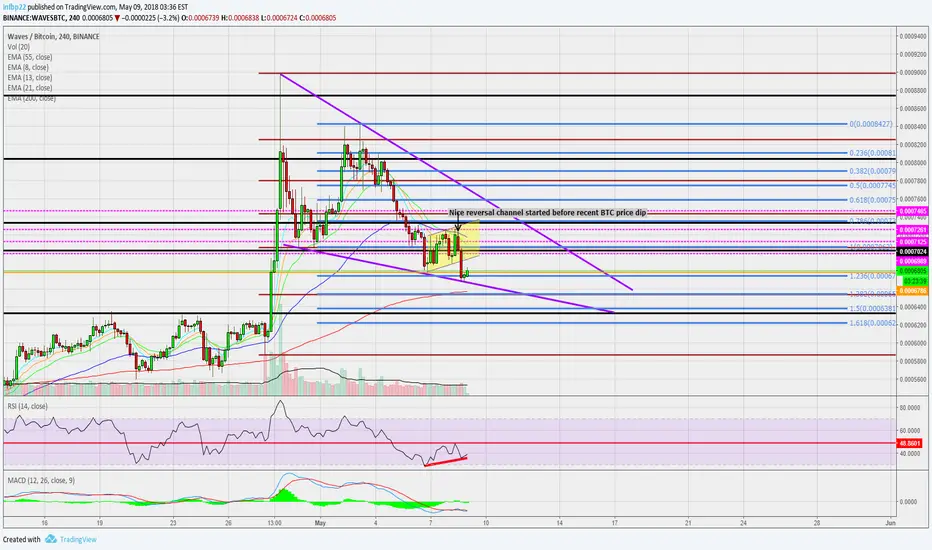
WAVES: UPDATE- 30 minute hidden bullish divergenceHere is the 30 minute hidden bullish divergence. Hopefully this can accelerate us out of the descending wedge for another breakout.

Waves: 4 Hour chart- UPDATEWaves is still moving nicely; the 4 hr divergence has put us up 6% since entry. I will publish the 30 minute chart as well, which shows hidden bullish divergence this time. I've added potential targets to the 4 hour chart if we break out of the descending wedge. The divergence on the shorter time frame may give us that fuel.

LONG - target to 50% fibs 50ma - target 7422Bullish divergence on RSI & CCI
if BTC plays ball we should see the target 7422

WAVES: 4 Hour Chart. Breakout soon?Waves took a nice little dip on this recent drop, which I bought. See the chart, I think it's going to go back onto its path and continue up to break out of the potential descending wedge. RSI it 17 on the 15min chart on the drop, and it looks like we may have some bullish divergence on the 4 hour chart now. I'm already in this trade at the orange line.
WAVES - HIDDEN BULLISH DIVERGENCE - 4hSome hidden bullish divergence, if price breaks above that 70k key level, maybe another run towards downtrend line, and if breaks, another great run.
I'm long - Hidden Bullish Divergence detected.
Stop losses activated (0.382 and 0.236 Fibonacci levels)

CROSSING TREND LINE - LONG - target 7615RSI broke above last resistance
Order crossing above trend line to target 7615

Waves can get you over 200% profit!!! Waves
Buy @ 60k
Sell @ 88k, 120k
Profit so far at 16%, HODL...
Looking from the chart, it also went full retracement, buy before it goes up!!!

WAVESIt would be nice if you rolled back to the zone 68000-70000
Good volume went
Objectives:
92000
11500


WAVESBTCWaves just looked around, watched everybody going crazy on last bull run. If it can go higher than Depeche Mode resistance, will listen Adam and The Ants for sure.

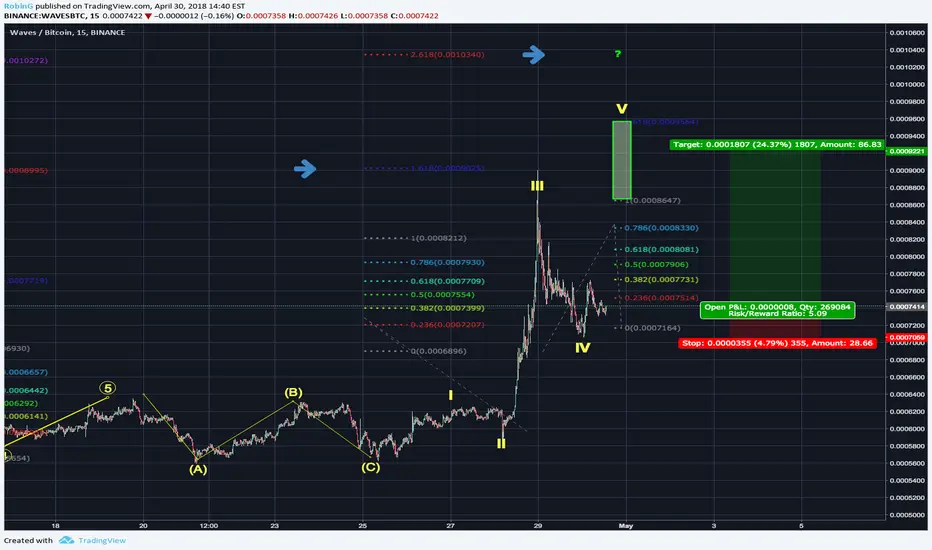
WAVESBTC - Revised CountSo waves was not mid-wave 3. The count is really strange on the wave 3, so I didn't think it had fully run it's course.
I -still- think the count is really strange, but there is no question that the corrective pattern broke below 0.0007251 - got as low as 0.0007060.
So this was a 5th wave corrective pattern. Touched below the 0.5 retracement line, and has been holding firm above there since.
I give it about a 60% chance that this corrective pattern is complete, and it should be starting a 5th wave up in the next day or two. May trend sideways for a while before picking up momentum.
I have to revise my end targets too. Based on Fib ratios I think the landing zone will be around 0.00091, give or take 0.00005.
Kind of a wide margin unfortunately, but there aren't too many good confluence zones to predict from.
Wave 1 would suggest it will touch the 0.001 line, and then fall back to around 0.000902.
Wave 3 line would suggest it will land around 0.000915.
Pretty giant field to play in. I think we can expect 0.00086 ata minimum, which is still a 17% boost from it's current price.
Good luck!