WAVES/BTC Main trend. Downlink. Entry points.On the WAVES/ BTC chart, I showed the main trend of this trading pair. Term 1 week.
As you can see, the main trend of this Russian cryptocurrency known to the whole crypto-world is expressed downward.
This downtrend has formed a downtrend channel with an impressive step. Pumping from the channel bottom to resistance in secondary trends occurs at the level of 370 - 460%. In the last pumping we are now in a secondary trend. Also pleasing are the same impressive dumps, always about 90% of the pump height. This is a gold mine.
A trader's best friend is volatility . Its correct use can inflate your deposit to an indecent size.
A secondary trend is currently developing. A local descending wedge formed in it on the pullback from the resistance of the main trend line (red thick channel resistance line).
Local work with this form. Possible entry points.
I showed potential entry points from the development of market situations on the chart.
Always work with the trend. Pay attention to small details that most people don't see.
Always work with the trend. Trading against the trend is the same as falling under the locomotive and hoping that it bounces off you!
WAVESBTC trade ideas

Waves Trading AnalysisHello Traders,
Waves is close to an important support level and did a bullish wedge formation, we would recommend opening a long position if it indicates that will continues its upward movement with a good candlestick formation like a bullish engulf or a beartrap above the support.
For more analysis like this, please push the like button and follow us on Tradingview.

WAVESBTCAfter a good correction Waves seems to make a flat pattern. Wave B of this flat was a diametric pattern and we are at the endpoint of this diametric and wave C will start soon.

WAVES/BTC (Retested Key Support)💎Technical Analysis Summary💎
BINANCE: WAVESBTC
-WAVES retested key level of support around the 2000s sat
-We can see the price is starting to move up slowly
-This is a good sign for the Bulls
-But the big enemy is the downward trendline resistance
-Until this line is valid, the Bears can easily enter the market
-I recommend waiting for the breakout confirmation
-And observe if the Bulls can hold outside the resistance zone
A big Thanks for donating 💰 via Tradingview coins this week to ahancock 🙏🎉
``````````````````````````````````````````````
Trading Involves High Risk ⚠️
Not Financial Advice 💸
Please Exercise Risk Management 💱
``````````````````````````````````````````````
Thank You All!🙏😊💖For Supporting My Channel 📺
Through Leaving A Thumbs Up, Comment & Follow 💬
Happy Trading!😊💕💖
``````````````````````````````````````````````

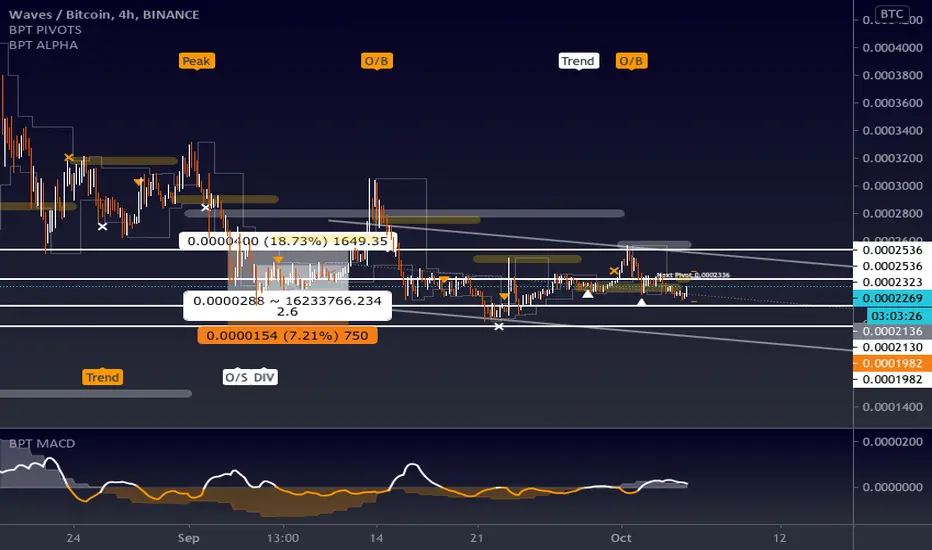
WAVESBTC - Long - Potential 18.73%WAVESBTC - Long - Potential 18.73%
Entry- 2136
TP1- 2323
TP2- 2536
SL- 1982
Happy Trading! The trend is your friend until the end when it bends.” – Ed Seykota


Waves buy the break of trend lineAll data clear in chart buy the break
If the price able to break the trend and hold above 0.236 fibo resisance it can give good profit
Just wait the break dont buy now
The take profit area also shown in fib resistance in chart
If you like my idea hit like button and follow
Good lucks

WAVES/BTC (Downward Channel?)💎Technical Analysis Summary💎
BINANCE: WAVESBTC
-WAVES still trading inside a downtrend channel
-Which is a Bullish reversal pattern once confirmed
-I'm expecting a consolidation for a few weeks
-Before we can see a large move, either up or down
-There is also a chance to revisit the key support area at 2000 sat
-So please be patient and wait for the proper entry point
``````````````````````````````````````````````
Trading Involves High Risk
Not Financial Advice
Please Exercise Risk Management
``````````````````````````````````````````````
If You Like My Daily Published Ideas
A little Help By Supporting My Channel
Through Leaving A Thumbs Up, Comment & Follow
Happy Trading! --> Thank You! :)
``````````````````````````````````````````````


WAVES needs to crawl first before it can flyAs presented we are now in a phase of correction and I believe WAVES may dip sub 20000 satoshi again (0.236 fib or 19500-17500 satoshi area) before it consolidates there and push higher again. I believe this is purely technical move as all alts are correcting the same and looking for lower support zones
What to expect short term?
target for correction - 19500-17500 satoshi area
bottom (btc) reached by 1st half of October
What to expect medium term?
new highs (btc) by 2nd half of November
target for new move up - 85000-120000 satoshi by the end of 2020
What to expect long term?
Provided that crypto sentiment does not change at least 2 more moves up:
firstly new ATH (btc+usd) around mid 2021
secondly new ATH (usd) before the years end.
Not an advise, do you own research.

WAVESBTC - Long - Potential 20.97%WAVESBTC - Long - Potential 20.97%
Enter- 2522
TP1- 2721
TP2- 3050
SL- 2300
Happy Trading! Like & Follow if you Agree!

Cup and Handle ready to go bullish??Looking at the 4hr chart it looks like a cup and handle forming nicely. Currently on a #8 candle of the buy setup according to TD sequential. Will we see upside in the next 8 hours and a breakout of the handle? Lets see and hope BTC doesnt do anything crazy!


waves price Fibonacci ProjectionWavesbtc completed its Fibonacci Retracement and bounced of its its Fib support level. Currently waves is at the 0,236 Fib.
If coming year the alts market remains solid, the following targets are foreseen.
Current price: 0,0002882
Next targets
1st 0,0003210
2nd: 0,0003493
3rd: 0,0003771
4th: 0,0004204
5th: 0,0004687
6th: 0,0006116

WAVES/BTC (Strong Bounce @ 50D MA?)BINANCE: WAVESBTC
-Waves bounce strong from 50D MA and upward trendline
-It is now testing two trendline resistances
-The downward and horizontal resistance lines
-If Waves can above the downward trendline
-But unable to break the horizontal resistance
-I expect it to consolidate inside the small triangle
-Still too early to provide an entry and exit point
-I'll wait for better price action or pattern
-Before sharing my potential trading plan
^Trading involves High Risk
^Not Financial Advice
^Please exercise Risk Management
**If you like my daily Published Ideas
**A little help by supporting my Channel
**Through leaving a Thumbs Up, Comment & Follow
**Happy Trading! --> Thank you! :)


WAVES/BTC: Consolidation Before a Bullish BreakoutIf you like this analysis, please make sure to like the post!
I would also appreciate it if you could leave a comment below with some original insight.
In this analysis, I'll be analyzing Waves' technicals in order to assess its bullish probabilities.
Analysis
- To begin with, Waves is currently consolidating within a descending channel
- While creating lower highs and lower lows, this is a potential bull flag setup
- After reaching support, it has formed a bullish ascending triangle
- Within this triangle, we can see that it formed a textbook Elliott Triple Wave Combo Wave (ABCDE)
- From this bullish setup, it broke out and closed above the 0.236 Fibonacci retracement resistance
- We are yet to test the resistance at the 0.382 Fibonacci level, and could expect a rally to continue up to the 0.618 resistance
- A break above the descending channel trend line would confirm a further rally to retest local tops
Conclusion
Taking into consideration that Waves 2.0 Testnet will be released around September 30, and the current bullish setup, we could expect a huge upside for this altcoin.
Don't predict the market. Take it by levels, and play by probabilities.
- Michael Wang-


