WAVESUSDTif 1h candle close above 26.65 and above triangle , it will go up to 28.765
if 1h candle close below triangle , it will go down to 23.765
WAVESUSDT trade ideas

'Buy the breakout' idea here. Indicators support continued uptrend once breakout of resistance and pattern is achieved. TP target from the measured move at the start of the pattern.

WAVES, what is next?Here is what I see with waves:
1) We've been in descending channel for quite some time now, recently retesting the lower boundary and now the upper.
2) The red box I drew out a few days ago, and we see that waves is experiencing enough resistance to stop it dead in its tracks for almost a week now. This red box represents a key a zone of resistance (from previous price action) as well as the area between the golden pocket and the .236 level.
3) We have rallied 300% very quickly here in the past few weeks on waves. I believe it is time for a cooldown.
4) Scenario 2 is much more likely to play out that scenario 1 in my opinion, but scenario 1 is still on the table.
5) Scenario two will likely bring us back to the green zone of support below us, before moving back upwards. If we fail the green box, waves could potentially reset its entire price action for the past month or so by making its way to the lowest green box.
6) The RSI has been hanging out in the overbought territory for too long on the daily. We need a pullback if we want to sustain further upward price action IMO.
Overall I am short term bearish. Depending on how BTC reacts within the next few months could be a determining factor on waves in the medium/long term.
Remember, this is not financial advice and always do your own analysis/research before making any decisions on the market.

It's time to rest and reduce! Enough ascent.During this time, a good return has been made for those who had this crypto. It seems that the historical resistance will be a strong barrier and the price must be corrected.


Potential Swing Bearish/Short Waves UsdtTaking into account the current bearish nature of the market,most of the times those assets that tend to pump hugely without any logical reason except pump and dump scenarios, tend to crash the hardest as well.
I believe this asset is a strong candidate for this type of trading.
Key points:
Type of Trade : Short
Stop loss - 35- 32% movement
Take profit - 18 - 32% movement
Take profit - 10 - 63% movement
Capital used - 1% of the account for stop loss making a 1 - 2 profit factor trade in case of winning

waves hug descending Channel Pattern#waves hug descending Channel Pattern
A descending channel pattern consists of two parallel lines that are equal distance apart and surround price action.


Waves ; Bearish pattern I am sure that it down to area 18 & $20
Do you think about that?!
Then waves going to go up

BIG CRASH INCOMING FOR WAVESSee the chart and judge for yourself.
WAVES/BTC chart below, at big resistance as well.
NO FINANCIAL ADVICE


Another WAVE for WAVES?!!!?A pole and flag formation for waves!
Previously when we saw this pattern, we witnessed a strong upside move!
Now the scenario is very much similar!
Expecting the same WAVE!
$35 is a big fat figure and that is gonna be my target!

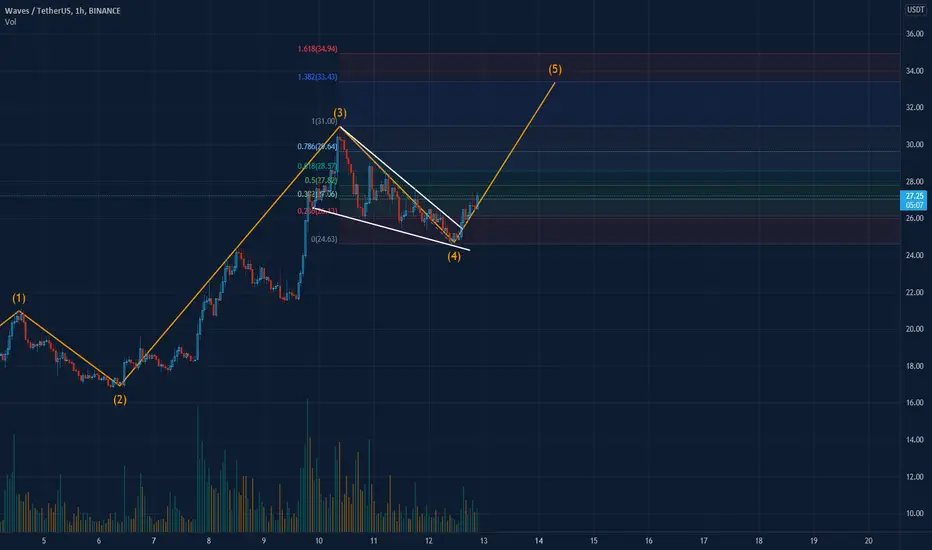
Don't miss the party, it's not over yet.The falling wedge of wave 4 has finally played out, bringing the price up to 27.3 . In my opinion, it should reach 33.43 soon. Don't miss the party before WAVES probably enter a consolidation (or maybe distribution) period!
(Just an opinion!)
long wavesgyufyfiugkiuhuihou2hed32i3u2ghrbeifueiflb2eufbh2efui32gfil32fui3hfui32bfhui32lfb23hf2wufb32gyufruijidhu3y2fiwjfb23uyfuif

Set up with price target for breakout of WaveI see a descending triangle, with falling volume on declining price a bullish reversal idea. Bullish cross on Stochastic. Entry on breakout or retest of trendline.

Wave is about to bounce wave made an explosive move to the upside and thus a correction was inevitable. I believe we might witness a small move to the upside/retracement

waves usdt go long if this crazy drop happensbe prepared for any sharp moves in market and this is good coin to buy the dip in case market drop a lot all details in video

Waves to 30$ Waves have been trading inside a Triangle pattern, If the price break the downtrend we can see the targets as you can see at the chart

WAVES/UPDATE/NEW IDEA~ WAVES may form head & shoulder pattern
~ This may support at 23.37 then pullback at 26.2 to form the right shoulder then go down to 18.65
~ Bearish divergence was also present at 4hrs tf
~ 4hrs tf bearish cross was confirmed means were on a sell bias for lower tf

WAVES.Usdt (Y22.P1.E1).3 ScenariosHi All,
This attempt to break the structure failed in my opinion but I could be wrong.
With the assumption that it has, and the likely scenario that we 1st visit 37k for BTC as longs get liquidated.
BTC can have moderate correction which means we find support at 35k, or deeper with capitulation to 24k-25k or worse, 14k to 18k.
Based on those scenarios, WAVES might do the following as well.
All the best,
S.SAri

