Axelar (AXL) – A Cross-Chain Leader Ready for BreakoutAxelar ( NYSE:AXL ) is positioning itself as one of the most promising projects in the crypto space, delivering "secure cross-chain communication for Web3." The protocol offers a decentralized network and a comprehensive suite of tools and APIs to enable seamless cross-chain communication for decentralized application (dApp) developers.
With Axelar's focus on interoperability, it aims to become a crucial player in the future of DeFi and Web3, ensuring secure and efficient transactions across multiple blockchains.
Axelar (AXL) Technical Analysis
Who says that when Bitcoin (BTC) is in a downtrend, other coins can’t perform? Contrary to BTC's recent decline, Axelar has been breaking key resistance levels. The price recently surpassed the $0.80 barrier, following a base-1 formation, and has now established a small support level around the $0.85 resistance zone.
In the last few sessions, we’ve observed increased trading volume, suggesting strong momentum. This surge in volume could push prices even higher. Notably, AXL has also broken above the 200 SMA (Simple Moving Average), a major technical resistance.
Potential Targets
With this bullish momentum, the next key target we are eyeing is around $1.60. If the trend continues, further upward movement could follow.
Good trading to all!
WAXLUSDT trade ideas

AXL/USDT Analysis: Potential Long-term Upside from $0.46 - $0.56The chart indicates a possible bullish setup for AXL/USDT on the daily timeframe. The price is currently testing the support zone between $0.46 and $0.56, suggesting a potential entry point for a longer-term upward move targeting $2.1.
Detailed Analysis:
Price Structure:
AXL/USDT has been in a downtrend, followed by a consolidation phase near the support zone at $0.46 - $0.56. This range has acted as a strong support in the past, suggesting a potential base for a bullish reversal.
The price action in this area shows the possibility of an accumulation phase, which could serve as the foundation for a long-term rally.
Entry Price:
The ideal entry zone is within $0.46 - $0.56, where the price is currently consolidating. This support range presents a lower-risk entry point, supported by potential bullish momentum building in the coming weeks.
Target Price:
The long-term target price is set at $2.1, which corresponds to the previous major resistance level and aligns with the projected potential for a breakout from the accumulation zone.
Key Support & Resistance Levels:
Support: $0.46 - $0.56 (current entry zone)
Resistance: $0.93 (intermediate resistance), $1.52 (major resistance), and $2.1 (long-term target).
Risk Management:
Stop Loss: A stop-loss can be placed below $0.45 to limit downside risk, as a break below this level could invalidate the current bullish setup.
Trade Plan Summary:
Entry Zone: $0.46 - $0.56
Take Profit: $2.1 (long-term target), with potential intermediate resistance at $0.93 and $1.52.
Stop Loss: Below $0.45
Conclusion:
AXL/USDT is currently forming a potential bullish base at a strong support zone, suggesting a long-term buying opportunity. The analysis indicates a potential upside toward $2.1 if the support holds and the price breaks through the intermediate resistance levels.

#AXL - Set for a 236% Surge! #AXLUSDT is primed for a massive breakout from a falling wedge pattern, indicating a potential 236.07% gain. Currently trading at $0.5447, this setup offers an incredible opportunity to ride the wave up to $1.2826. Don't miss out on this explosive move!
⚠️ All trading ideas are published with a time delay. If you want to follow the trading in real-time, please follow the link:

Long AXLUSD ideasTrade1: Entry on demand area, above support (0.76), SL under support. TP: middle of the channel, depending on when the trade happens.
Trade2: Entry on low of the channel. 4h support. (0.67)
SL: under that support. TP: close to the resistance. Conservative: below. Expecting getting back in the channel , longer trade: above the green resistance

Short Ideas AXLUSDTrade1: Range Play . Entry top of the range. SL: above resistance. TP: in the demand zone.
Trade2: ChannelTop + Supply zone on higher timeframe.
SL: above the supply zone
TP: somewhere on support , middle of the channel.

AXL still has a great trade set upAXL on pull backs to 0.61-0.65 level presents a great position trade for the long term. I will be accumulating in any pull back. My initial price target is 1.26.
This is a 2 day chart so it will take some time to play out. Wait for the pull backs. Both Market Cipher and my modified MACD looks good for a long trade. This is not a financial advice. DYOR.

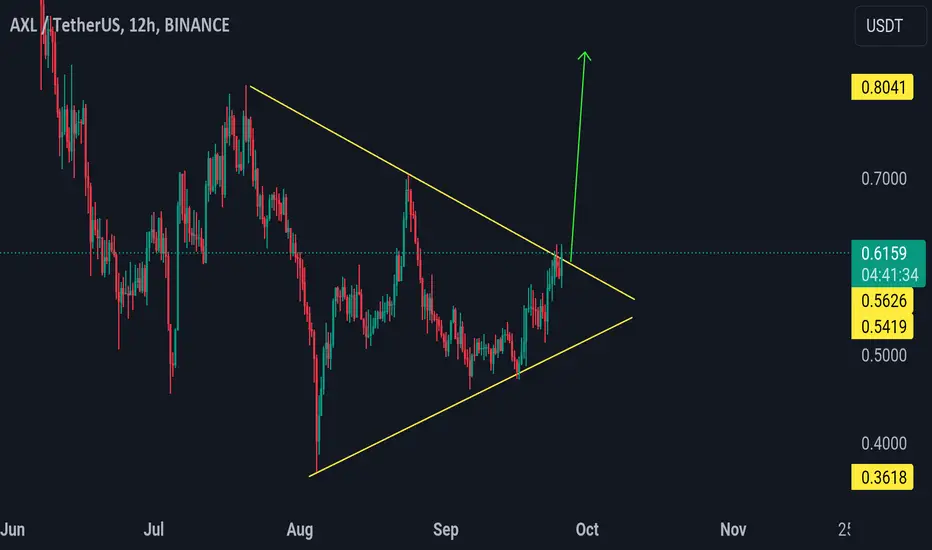
AXL/USDT Plan Axl/USDT is currently approaching a potential breakout from a triangle pattern, suggesting that a significant price movement could be on the horizon. If the breakout is successful, I anticipate a bullish trend in the coming days. It's important to monitor key resistance levels for confirmation. Remember, this is not financial advice; always do your own research (DYOR) before making any investment decisions.
AXL superbWhenever a Fbuy triggers then it's either a trend reversal or trend continuation. we've shorted after getting the Sell print and targets will be that blue line or the lower green line.
We had only two triggers this day. It was Rose and AXL
DYOR

AXL. 0.66. LONGThe token has a very large accumulation. No rollbacks. The buyer holds the price. In case of a breakout of the key level, a good impulse can be expected.

Descending Channel Breakout done!🚨 NYSE:AXL is breaking out of a Descending Channel pattern on the 1D chart, which is typically a bullish reversal signal.
📈 Entry Point: $0.60 to $0.65
🎯 Targets:
$0.78
$0.88
$1.28
$1.64
$2.38
🔄 Trading Options: NYSE:AXL is available for trading in both spot and futures markets. You can purchase it on the spot market, or if you prefer to go long on futures, consider setting a stop-loss at $0.50.
📊 About NYSE:AXL :
AXL (Axelar) is an innovative project in the crypto space, offering decentralized cross-chain communication for Web3 applications, enabling seamless interaction between multiple blockchain networks.
📢 DYOR, NFA

AXLUSDT 2DAXL ~ 2D
#AXL We would say Bullish on this Token once it breaks the resistance line of this descending pattern.


AXLUSDT Technical Analysis in Daily TimeframeHello everyone, I’m Cryptorphic.
For the past seven years, I’ve been sharing insightful charts and analysis.
Follow me for:
~ Unbiased analyses on trending altcoins.
~ Identifying altcoins with 10x-50x potential.
~ Futures trade setups.
~ Daily updates on Bitcoin and Ethereum.
~ High time frame (HTF) market bottom and top calls.
~ Short-term market movements.
~ Charts supported by critical fundamentals.
Now, let’s dive into this chart analysis:
AXL has broken above an important resistance trendline, indicating a trend reversal from bearish to bullish. However, the actual trend reversal will be confirmed when AXL breaks above the $0.8837 resistance level.
Entry: $0.6436 to CMP.
Close Position: If the price breaks down and closes below $0.5664.
Targets: $1.275, $1.632, $2.374.
DYOR, NFA.
Please hit the like button to support my content and share your thoughts in the comment section. Feel free to request any chart analysis you’d like to see!
Thank you!
#PEACE

$AXLMy AXL RoadMap for this week.
Pleae DYOR before take a position and make a decision.
Always use stop loss and manage your own risk.

AXLUSDT Breaking a Falling Wedge Pattern#Axl is breaking a falling wedge pattern and currently facing ma 50🧐
Successful upside breakout could bring 100%+ profit✈️
Stay alert for the breakout confirmation📝

AXLUSDT.PAXLUSDT.P is in bearish trend.
potentially printing LH and LL.
Bearish divergence also form in RSI.
No sign of reversal here. we sell at CMP.

AXLUSDT(Axelar) Daily tf Range Updated till 07-07-24AXLUSDT(Axelar) Daily timeframe range. its on price discovery level. below 0.4968 got pretty much unknown space to move. thats actually not a good part devs should have done something with their sell money. of course it can reverse recent resistance at 0.7270.

AXL on the RiseAXL is experiencing a bullish surge, evident from recent price actions. Key indicators show strong momentum, but critical resistance levels lie ahead that will test the durability of this upward trend.
Technical Insights
1. Support and Resistance Levels:
• Immediate Support: The price recently found strong support around $0.5400. Holding above this level builds a foundation for further gains.
• Immediate Resistance: The price is approaching a local resistance at around $0.6200. A retest of this level might be necessary before attempting to break higher.
• Solid Resistance: Strong resistance is marked around $0.6600. This level will be crucial to watch for potential breakout or reversal.
2. Momentum Indicators:
• Stochastic Oscillator: Both %K and %D lines are in the overbought territory, suggesting potential consolidation or a pullback before the next move.
• Relative Strength Index (RSI): The RSI is high, indicating overbought conditions. This could mean a cooling-off period is imminent, or it could signal strong bullish momentum if it sustains above 70.
3. Moving Average Convergence Divergence (MACD):
• The MACD is positive, with a bullish histogram. This suggests continued upward momentum, though the market might see some short-term fluctuations.
Most Probable Market Scenarios
1. Bullish Continuation:
• If AXL breaks above the immediate resistance at $0.6200, the next target would be the solid resistance at $0.6600. Sustaining this momentum could push prices higher.
• A strong bullish trend could be reinforced if the RSI remains above 70, indicating sustained buying pressure.
2. Pullback and Consolidation:
• Given the overbought conditions in both RSI and Stochastic Oscillator, a pullback to around $0.6000 or even $0.5800 could occur. This would provide a healthier foundation for further gains.
• Holding above the $0.5400 support is crucial for maintaining the bullish outlook. A break below this level might signal a trend reversal.
Outlook
AXL is currently in a strong uptrend with bullish momentum. However, the overbought conditions suggest caution. Traders should watch for potential pullbacks to key support levels, which could offer buying opportunities. Breaking through the $0.6200 resistance will be pivotal for continuing the upward trajectory towards $0.6600.
Summary:
• Short-term: Bullish but watch for potential pullbacks due to overbought conditions.
• Mid-term: Maintaining above $0.5400 support is key; a break above $0.6200 could target $0.6600.
• Long-term: Sustained bullish momentum depends on overcoming significant resistance levels and maintaining high RSI.

NEW ACCTIVATION AXLUSDTShowing new interest volume, which could be confirmed in the next time frames.
If this confirmation is done well, this coin could get a follow.
AXL have good volume range

AXL ANALYSIS (4H)From where we entered "START" on the chart, AXL correction seems to have started.
This correction seems to be a diametric.
Now it seems that AXL intends to complete the F wave of this diametric.
It can move from the green range of demand to the red range of supply.
Closing a daily candle above the invalidation level will violate the analysis.
For risk management, please don't forget stop loss and capital management
Comment if you have any questions
Thank You

AXLUSDTHarmonic Model Complete STOP 6.8%
The targets are clear on the chart with the prices. The first target is 15%. You are free to choose when taking profits. Good luck.

AXL Breakout on Lower TFA Breakout from the downtrend line is just happened in AXL. I will long from this mentioned area with low risk high reward position.
#nfa #dyor #aqeelonline

#AXLUSDT#AXL
We have a bearish channel pattern on the 12-hour frame, within which the price moves and adheres to its limits well
We have a green support area at 0.800 after the price touched it and bounced from it
We have a tendency to stabilize above moving average 100
We have a downtrend on the RSI indicator that supports the price higher with a breakout
Entry price is 1.00
The first goal is 1.19
The second goal is 1.33
the third goal is 1.52
