WHEATUSD trade ideas

WHEATUSDwheat is coming back down to an area of value clean structure and clean price action is forming on this the area in mind as shown with this breakdown on the charts!

WHEAT/USD next upward movement incoming?Hello!
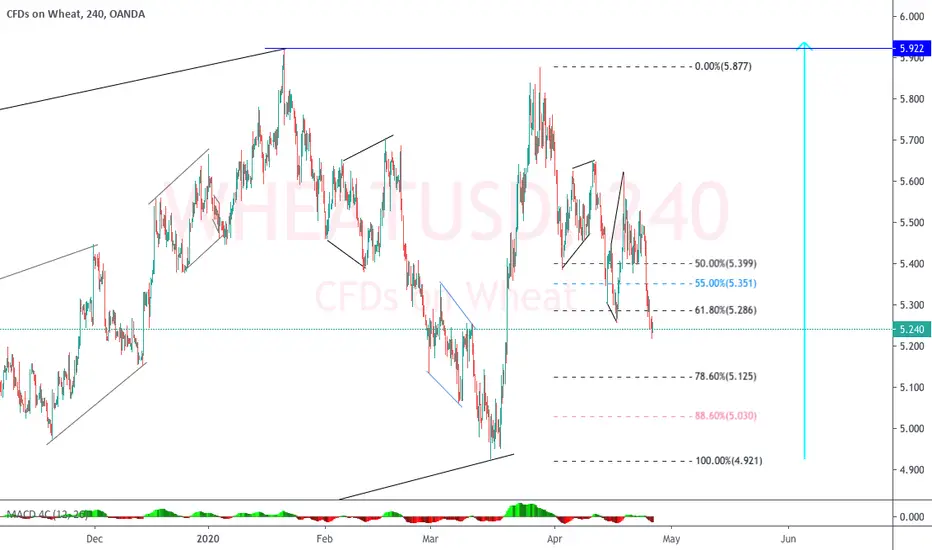
If we look at the one-year cycle, we see that between March and June, wheat prices usually go up. This has to do with the harvest times, which are mostly in autumn. We are currently in the last impulse of the Elliot impulse wave, which started in May 2019. Due to the last steep correction wave, there could now be a strongly rising pulse wave, which has already completed its first of the three pulses. The zones of interest are marked on the chart. This is my first analysis, so I would be happy to receive suggestions and suggestions for improvement.
Have a nice day and stay healthy!


Wheat Usd Short SetupPotential bullish overturn for the Wheat Usd, long term interests is in bears, needs monitoring

Wheat forming Lower HighKey levels Identified
- Black line : Monthly Resistance
- Maroon line : Monthly Open
Weekly Timeframe
- Third retest of Monthly Resistance level
- Last week candle close as an inside bar suggests consolidation, Expansion might be coming soon
Daily Timeframe
- Confirmed Bearish Pinbar with a close below its low
- Local 0.618 Fibonacci Retracement level
Idea: Looking for a retrace to ride to the downside. Unsure if this is truly a lower high as a lower high is only confirmed is there is a lower low.


Wheat Daily and 4 hour Setup PlayThe idea can be triggered here on the 4 hour, but first let us take a look at the daily chart.
We are at an important resistance zone on the daily chart. At around the 5.82 zone. What has caught my attention is the many indecision candles we have here. The two doji candles, candles with large wicks on either side. What this shows us is that there is a battle between the bears and the bulls at this resistance zone. We should definitely be paying attention to price here.
Moving down to the 4 hour chart, and we can see there are more confluences pointing to a possible downside move, and indeed, presents us with a trigger set up. Just looking at market structure here, it shows us an uptrend with higher lows and higher highs. We have had more than two swings which is what we want to look for.
At this resistance zone, we began to range. Look at the wicks here. The fake out candles. Price began to break out but reversed and closed below the previous open highs. This is why we remain patient and await candle closes before taking trades. This fake out trapped many traders to the upside.
We can also say that not only do we have a range here, but in fact, one can make an argument that there is a double top/ triple top at this level. Another good pattern we look for potential trend exhaustion. Putting those two together, the topping pattern and at a resistance level, already give us a good possibility of a downward move.
What we are now awaiting is for a break below this flip zone here (area that has been both support and resistance) at 5.620. Going back and looking to the left, you can see the importance of this zone with multiple touches. We have had a bounce at this zone but I am looking for a reversal and then a break below the flip zone. This would create our first lower high swing that we can work with in a new down trend. Price does seem ready to roll over.
On the fundamental side, there are stories now about supply chains being disrupted due to the virus. Hearing about rice farming and other crop farming being halted in parts of Asia. Stories like this are out of our hands, but can go against this trade idea. We shall await the developments and see if we get the break.


Wheat Long - Our Daily Bread I don't know about other parts of the world but in Eastern Europe it was the wheat that disappeared from the Supermarkets first not the toilet paper.
So I'm biased Long on this trade purely from what I saw happening around me.
Also it's almost April, harvesting for wheat comes towards the end of Summer. So I expect this to go up, maybe not all the way to 7 but towards that area. ( or not )

Wheat Futures Forecast: Buy the pullbacksFundamentally:
According to the Financial Times’ report:
Shoppers’ rush to stock up on non-perishable staples such as pasta and noodles to ride out the coronavirus crisis has boosted demand for wheat, which has risen sharply in futures markets on both sides of the Atlantic.
Prices have been supported by increased buying by flour millers while in France, shoppers have stockpiled baguettes to freeze, leading some bakeries to ration the nation’s favourite bread.
Wheat prices have also been lifted by efforts among various governments to add to strategic inventories. “The north Africans are buying a lot of grain. Stocks are moving from France to Algeria,” said Abdolreza Abbassian, senior economist at the UN’s Food and Agriculture Organization.
Heavy falls in emerging market currencies have also revived memories of 2010, when drought and a sharp drop in the rouble prompted Russia — the world’s leading wheat exporter — to ban shipments of grains for almost a year. Last week there were jitters in the market caused by speculation that Moscow and Kyiv were considering similar measures.
Levels as mentioned on the chart


WHEATUSDWHEATUSD 3-Hrly, the influencing High is 5.704, and we set our dynamic support line at 5.660 to 5.275 baseling, ...a pb-support which is a zone area would be 5.610.
If price breaks above dsl line then the setup will be invalid.

WHEAT W1 LONG TRENDThe situation with the corono virus has forced many countries to quarantine. The situation in the world is very tense and it is not known when it will all end. The population of the planet, realizing their participation in the near future, decided to replenish their food supplies well, which led to a huge stir and led to a huge shortage of some goods. We saw a lot of videos where people fight for products. This situation creates problems for the food sector, including wheat, which produces a large number of products. It must be remembered that the sowing season will begin soon, which will further increase the hype around the grain. Given the fact that the quarantine period may last, it can be assumed that this is a very long transaction. Wheat to buy !!!

WHEATUSD - The Perfect Time To ReverseWHEAT is currently at support at the rising trend line. We are also in a falling wedge pattern which is most of the time bullish.

Long Wheat Grains!The analysis for this trade was done on the monthly. Since Aug 2016 the cereal has been on an upward trajectory creating higher highs and higher lows consistently.The Nov 2019 candle broke out of the yellow zone which had been a resistance area since Oct 2018 and we seem to be testing this zone as support. Entry was done on H4 after the structure change was confirmed by the strong bulls from the yellow zone
Entry: 2 small positions @ 5.222
SL : 5.124
TP1 : 5.408 (RR-1.98)
TP2 : 5.518 (RR 2.91)
Risk management is key. . .


bearish breakout on Wheat, D1As you can see on the chart, it looks like we have seen a bearish breakout constellation. Over half a year we were in a bullish upside trend, which now got broken by price. First T/P should be around a 0.6 fib level.
This is a long term trade idea, so let price run and see if it works out.
Remember, trading is a business of probability.


WHEATUSD - LONGReason for going long;
- A higher low is set on the daily chart, now searching for a lower high or a higher high
- Break out the downward channel (4H)
- Price is in a bigger channel and that support line currently hold
2 targets on the chart
